Venture headlines describe the companies that raise. Their valuations tell us little about the companies that don’t.
Working thesis
Fundraising is biased towards winners, so observed valuations don't reflect the true value of the average startup.
Decision contextPricing rounds, comparing companies, and interpreting venture marks
Object
True value
The underlying value of the average startup.
Observation
Fundraising
A financing reveals a price for the companies that raise.
Direction
Overstated
Observed prices exceed the population average.
The way we talk about private valuations doesn't make sense. They don't mean what we think they mean.
Observed private valuations exceed the true value of the average startup. They bake in a severe selection bias, since better companies are more likely to fundraise.
As a result, we don't have an index of private valuations that accurately reflects the broader ecosystem. We only see a narrow slice of companies (those who fundraise) at a narrow slice of time (when they fundraise).
These misleading metrics dominate startup headlines and public conversation. They lead us astray in our efforts to understand the state of the venture market, and anyone using these numbers as a benchmark pays a price for it: founders pricing rounds based on peers' valuations, investors citing "comps," the LP marking their book. Worse, this misconception can mask deep structural problems.
When only winners transact, prices can rise even as the market beneath them deteriorates.
Valuations need a correction.
This is part two to my last essay, "Taking Stock of the Seed Stage." Reading part one is helpful but not necessary to understanding this piece.
Join the Syndicate
Long-form essays on the economics of tech, with the data to back it up. All signal, no noise.
Read by 5,000+ founders, engineers, and investors.
Private valuations are conditional prices
Private and public valuations are totally different conceptually. Public market valuations are a constantly evolving representation of the value of a company, with open participation in that process. It’s a lively debate with an unlimited number of participants. The debate is always on (minus nights and weekends), so there’s always an up-to-date view on what a company is worth.
Private valuations are nothing like this:
Participation is limited. Most potential buyers cannot buy the stock; most potential sellers cannot sell their shares.
When shares do move, they transact in one big spectacle. 20% of the cap table might change hands in a single moment, more akin to an idiosyncratic block trade than a liquid trading environment.
Then "trading volume" resets to zero and stays that way for months to years.
Rather than the always-on debate we see in public markets, it’s like an electoral debate: infrequent and unrepresentative, a media spectacle rather than an informative exchange. And like elections, the voting only happens once in a while.
Benjamin Graham described the market as a voting machine in the short run, but private markets are a voting machine that's turned off most of the time.
Public market
The debate keeps going
Time →
Continuous trading generates up-to-date pricing.
Private market
A round, then silence
??????
Time →
A financing reveals a price. Between rounds, value is hidden.
What we call a private valuation is really a financing price, the price at which an investor funded the company. It is not a trading price, the price at which investors buy and sell shares among themselves.
This generates two problems:
Timing: between financing rounds, we don’t know what a venture-backed startup is worth. Private valuations are in some sense instantly out-of-date as soon as the financing is consummated.
Composition: Successful fundraisers are a biased sample of the broader ecosystem, which makes them poor proxies for the average startup, particularly in a world of power law outcomes. Your fellow startup’s fundraise is more of a transaction comp than a trading comp, which limits the value of comparison.
In this essay I focus on the composition problem.
Valuing a startup is analogous to estimating the value of a house that hasn't changed hands in years. We all know the last sale price doesn't guarantee what it's worth today. Now imagine if only the best houses in the best neighborhoods ever sold. The average sale price could move in one direction while the average home value moves in another, as those groups are composed differently. In such a market, you’d be careful not to infer too much from transaction data.
⌂$100KNo sale
⌂$200KNo sale
⌂$300KNo sale
⌂$400KNo sale
⌂$800KSold
⌂$1.2MSold
True average value (All six homes)
$500K
The neighborhood we're trying to value.
Average sale price (Two sold homes)
$1M
The transactions we actually observe.
No mispricing required: every sale is fairly priced, yet the average sale price is twice the average home value. The distortion comes from which homes sell.
A private company valuation is not just a price – it's a price conditional on having successfully raised capital. That means aggregate valuation statistics embed two things:
the probability of successfully fundraising
the valuation (conditional on fundraising success)
What we really want (and what we erroneously think we're talking about) is the unconditional valuation, i.e. its true underlying value without regard to fundraising. But companies that raise capital are not randomly selected: company quality (growth, unit economics, etc) itself determines both odds of raising capital and the true value of the business. If more valuable companies are more likely to raise capital, transaction data overstates the value of the average company.
True value drives fundraising, which drives the valuations we observe. What we observe is not what we're really looking for, as we only observe valuations through the distorting "filter" of fundraising. The true, latent value of a given startup is hidden out of sight.
Full population
True value
Every startup has an underlying, hidden value.
Selection filter
Fundraising
More valuable companies are more likely to raise.
Selected sample
Observed valuations
We see financing prices only for successful fundraisers.
The fundraising filter
We can use this distortion to our advantage by inverting it.
In an equation:
"True valuations" refers to the unobserved average valuation of all startups, not just those that have raised more capital.
I won't go through the math here, but the selection bias has two components:1
In other words, selection bias comes from:
the degree to which successful fundraisers are more valuable than others (i.e. the "bias")
the proportion of companies that fundraise (i.e. the "selection")
The selection bias is positive due to the positive correlation between true valuations and fundraising, so observed valuations tend to be higher than true valuations.
If we can understand the way in which the fundraising filter distorts observed valuations, we can invert it, letting us infer the unseen, "true" valuations from the few we do see. This would give us something analogous to the valuations we observe in the public markets.
Observed inputs
Prices + graduation
What Series A graduates raised at, and what share of active Seeds graduated.
Model assumptions
The fundraising filter
The shape of the valuation distribution and the relationship between value and fundraising success.
Inferred output
True Value
An estimate of valuations across the full active population.
That is the general form of the problem; this essay focuses on Seed valuations in particular.
In the data we see how many Seed startups successfully raise Series A and the valuations at which they do it. We can use these Series A graduates to infer the valuation distribution of the active population of Seed startups from which they came. We can then compare the typical Seed valuation to the valuation of new Seeds.
Gatekeeping
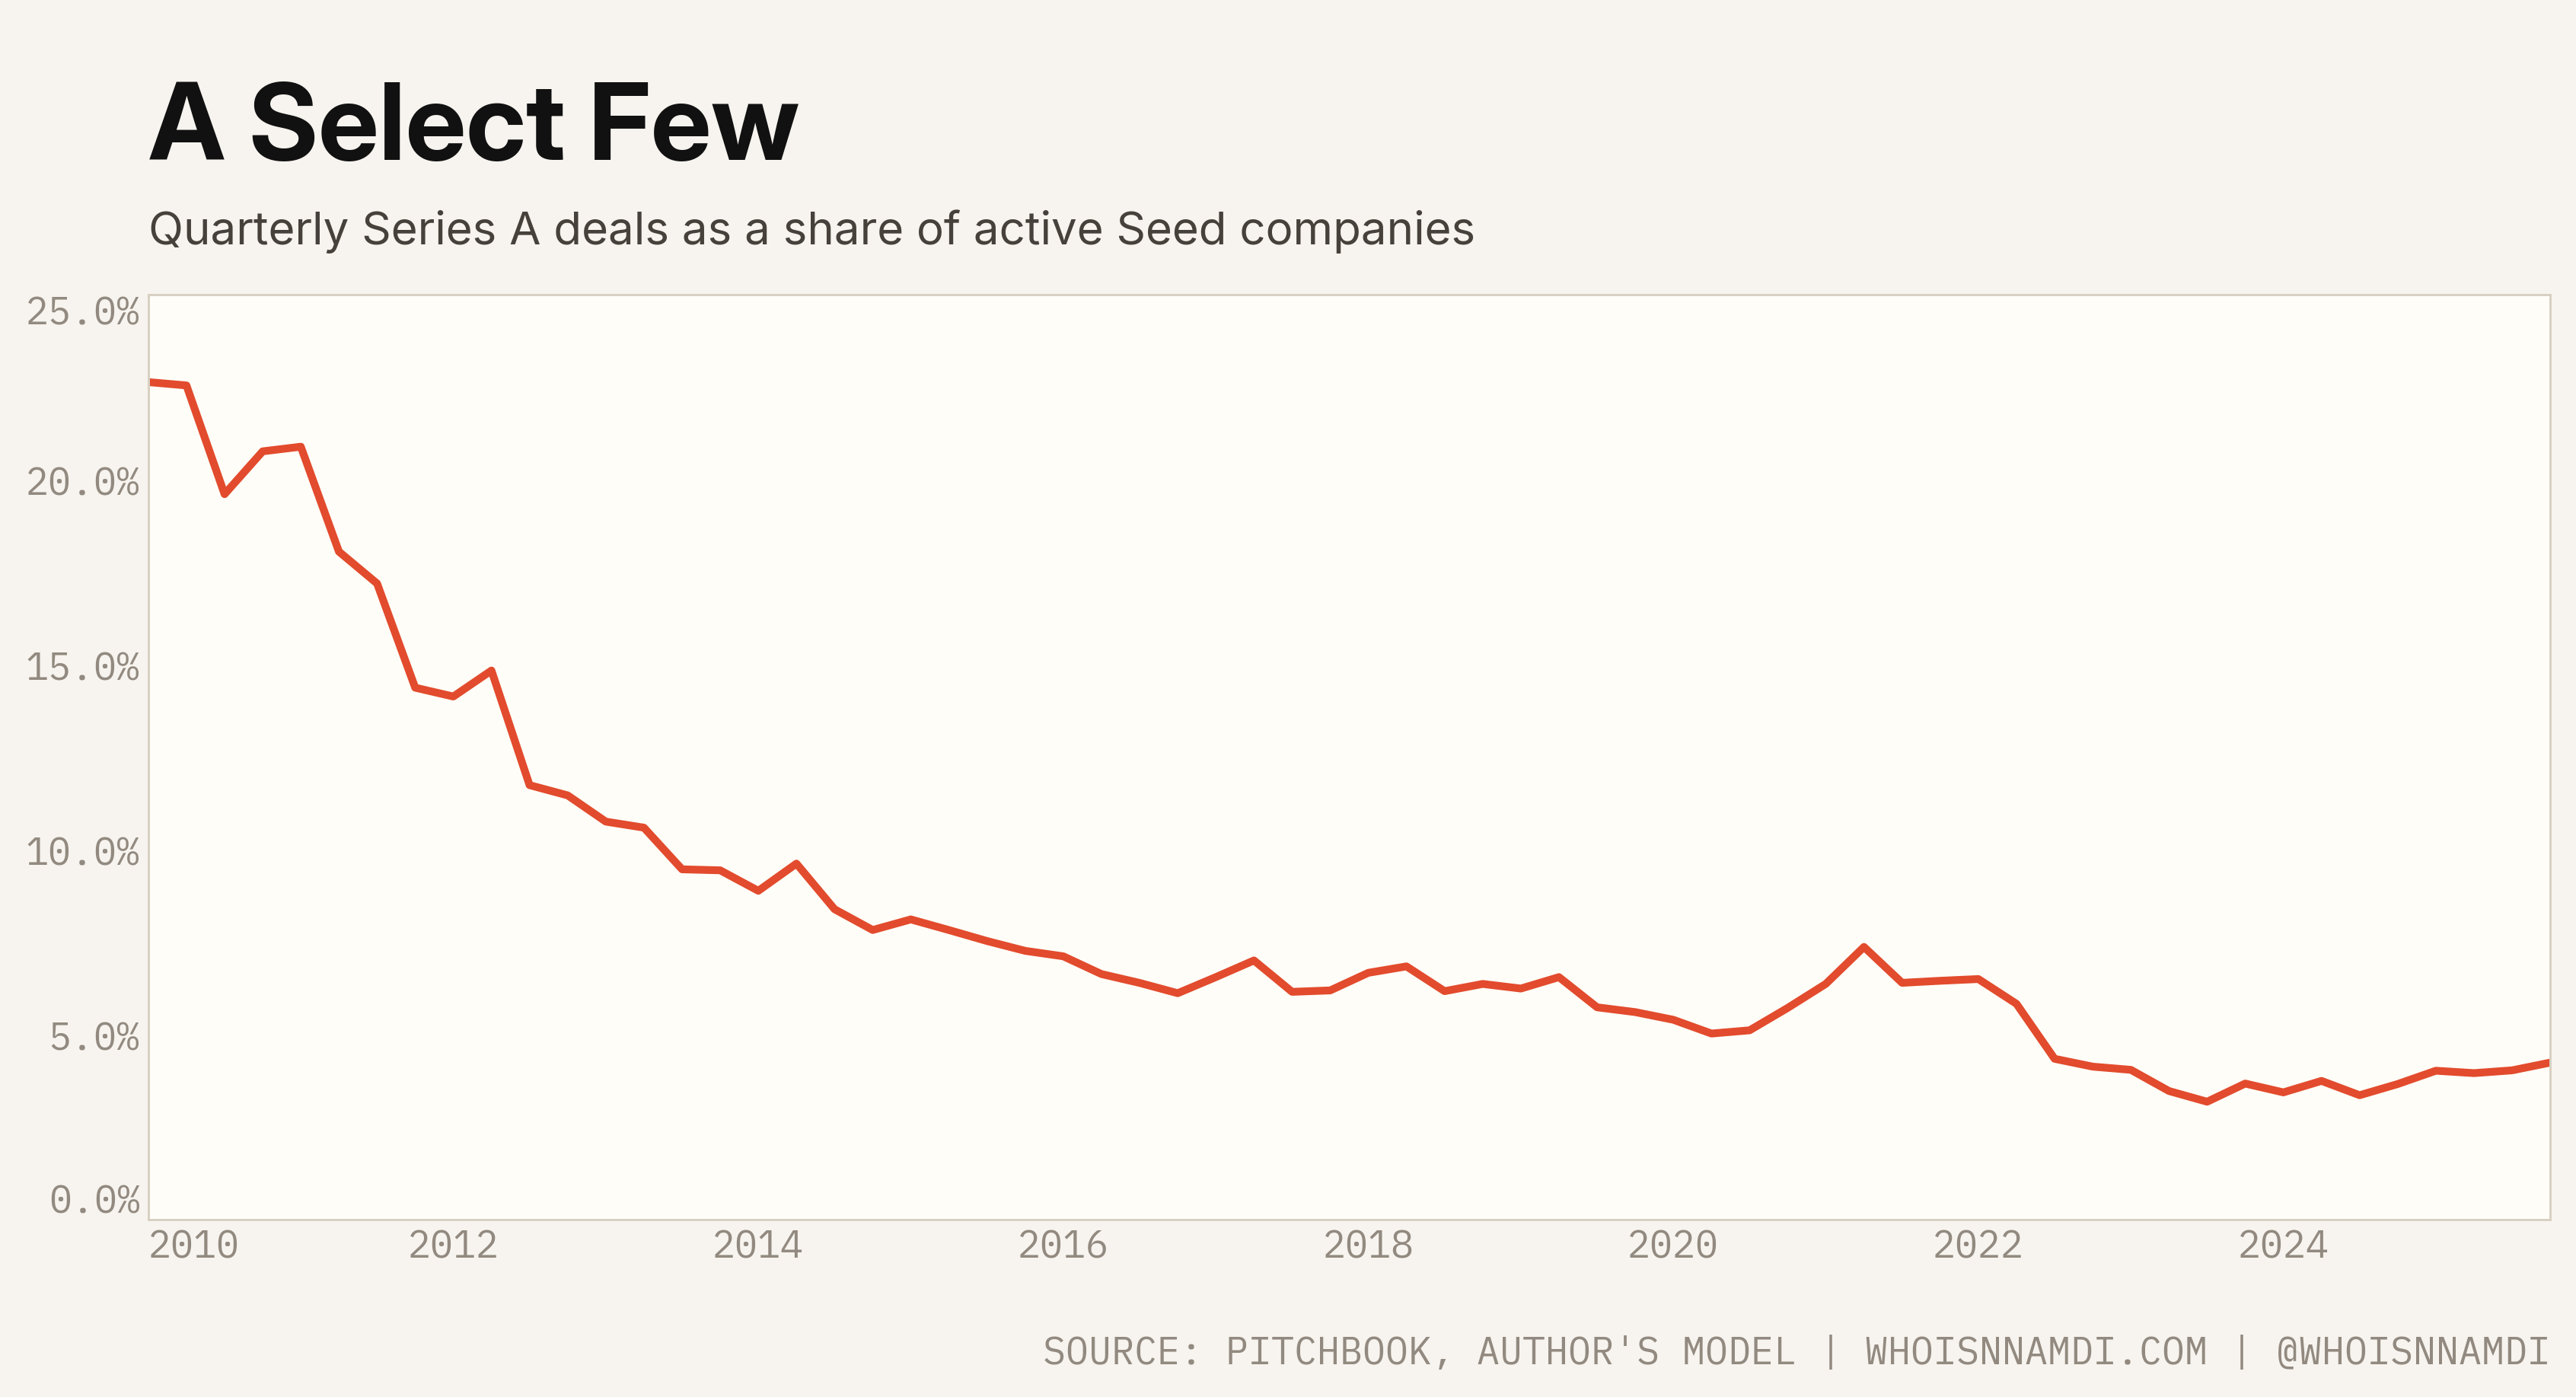
This is why I went through all that effort in my last essay to estimate the total number of active Seed startups. Divide Series A deals by that count to get the quarterly graduation rate:
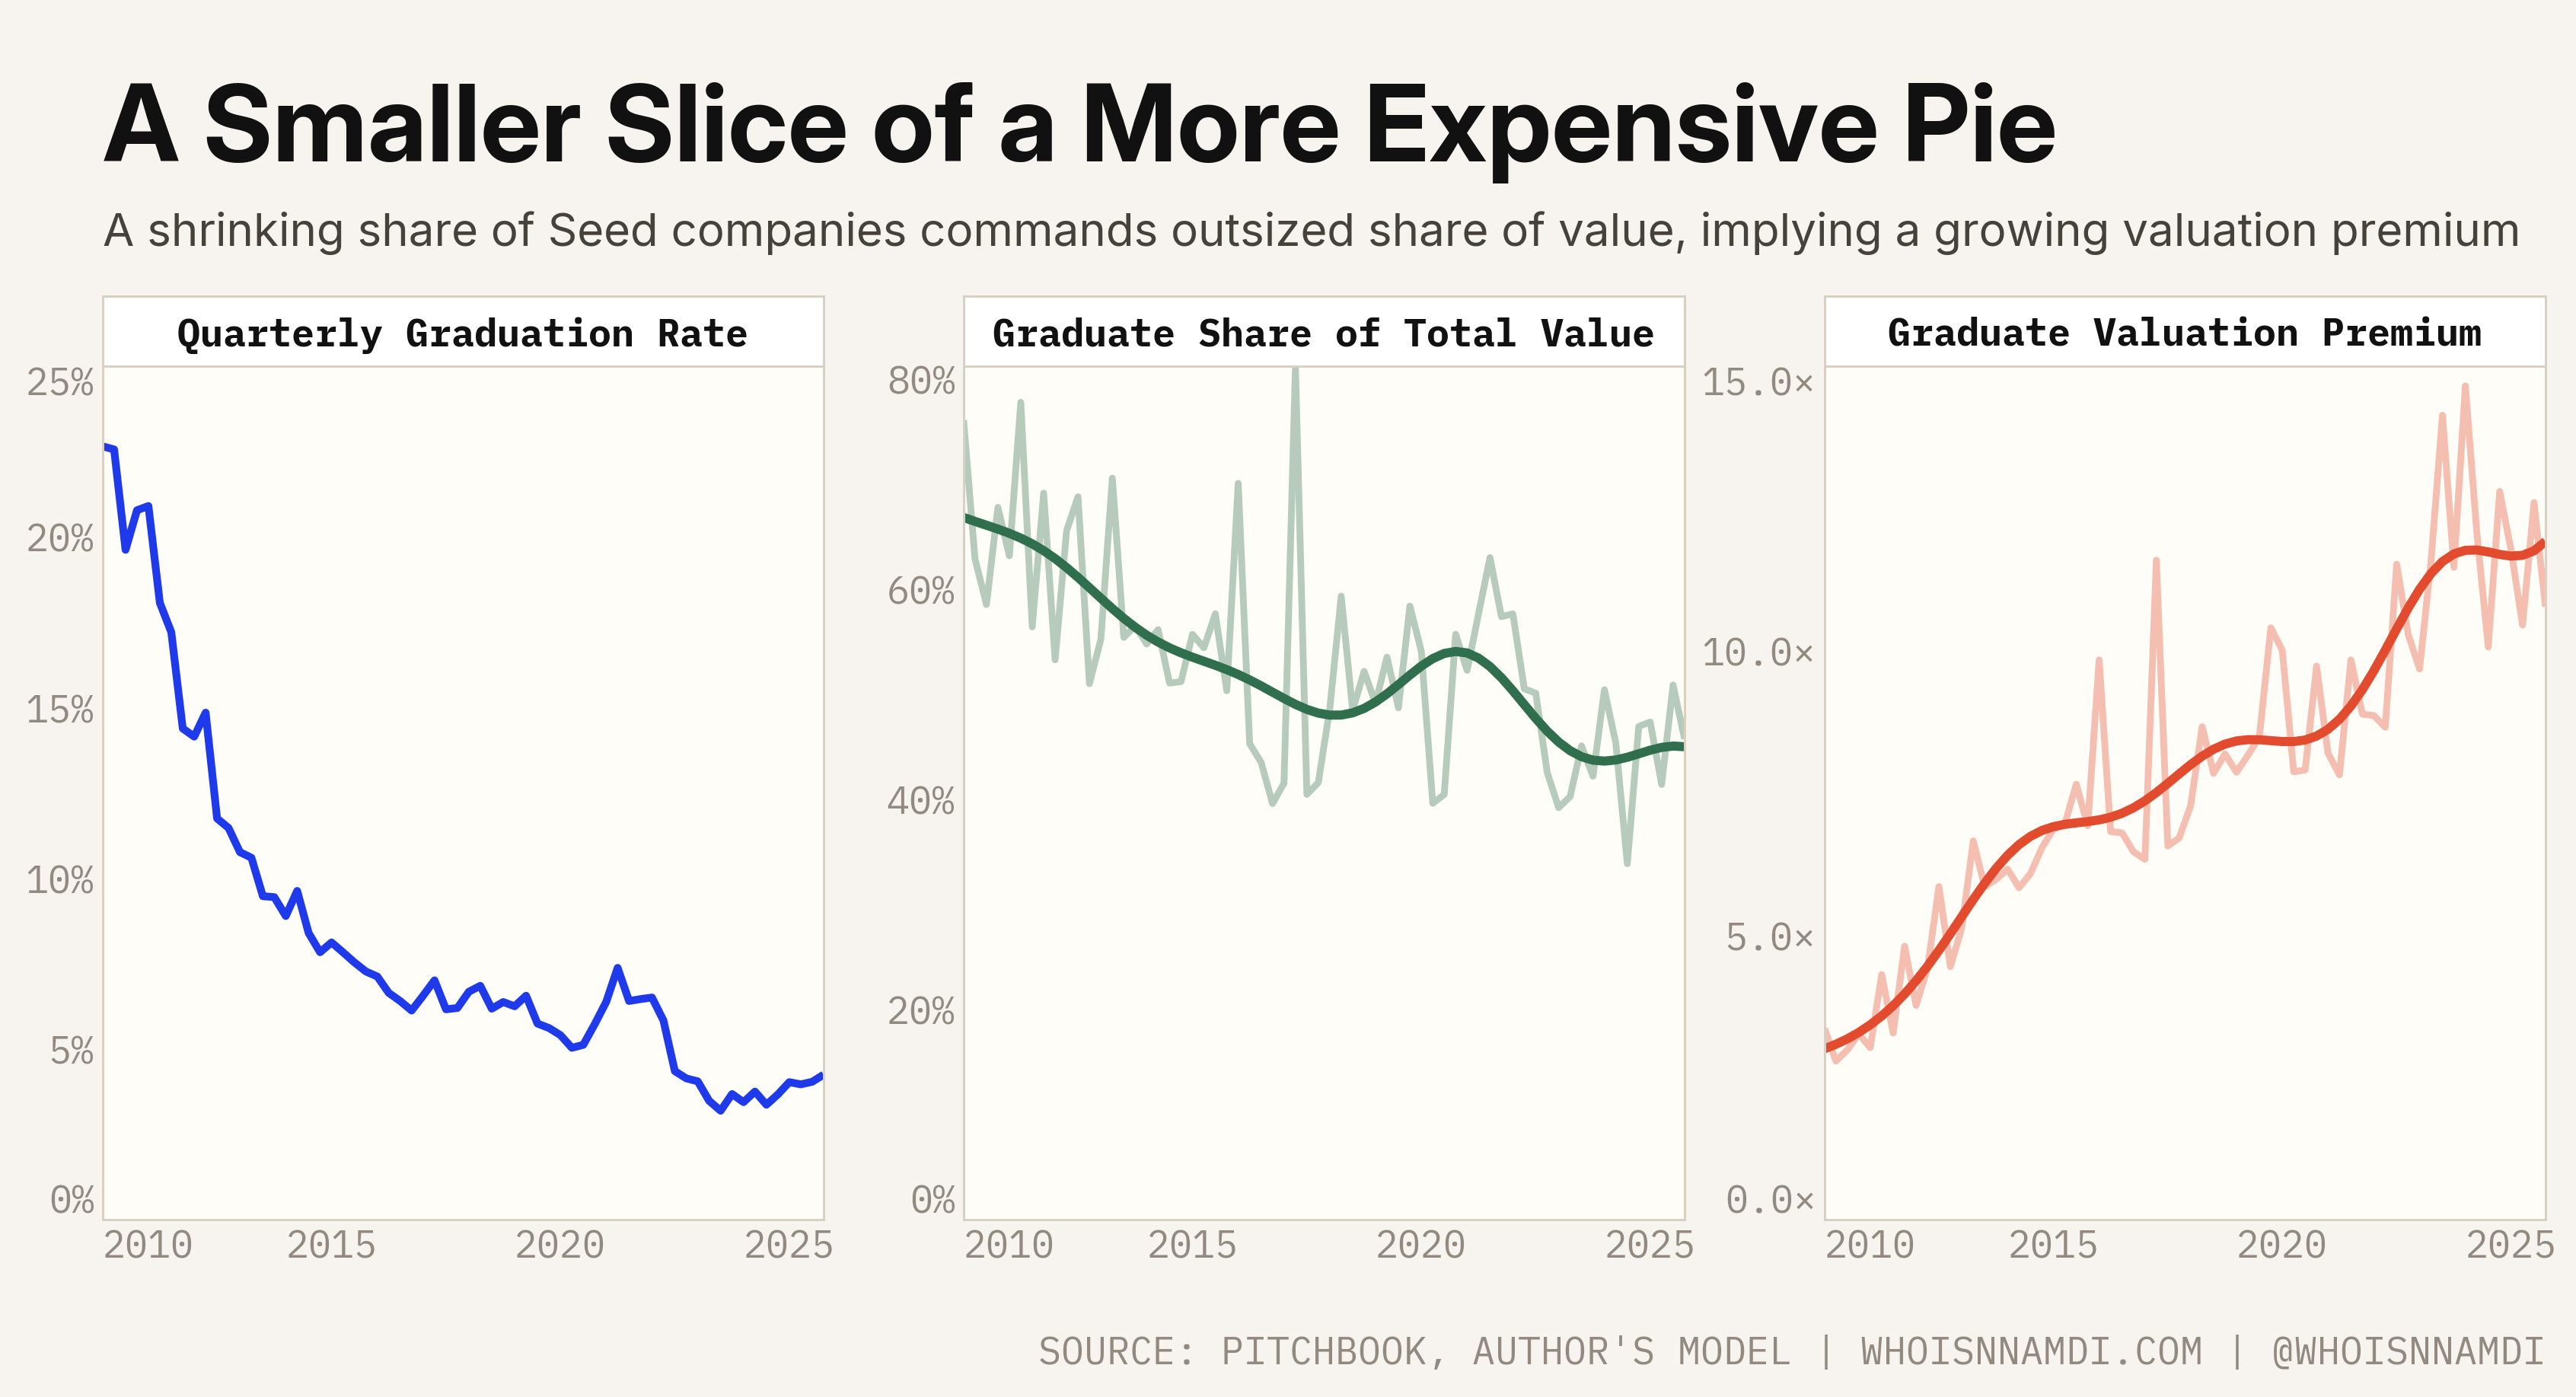
This chart says: of all active Seed startups, what proportion graduated to Series A each quarter. It's fallen substantially over time, mimicking the collapse of cohort-based graduation rates, though distinct conceptually. We can see the small recovery in the heydays of 2021, followed by another drop-off. As I discussed in "The Series A Bust":
... the numerous startups that raised Seed funding during the boom are now facing a massive bust. Ironically, though 2021 was the "best" time to raise a Seed based purely on venture activity and valuations, it was the "worst" time to raise Seed funding once you account for today's tough Series A environment. – The Series A Bust
Put simply, the "selection" in selection bias has gotten much more severe.
Price signals, plus a little noise
Now, if we take seriously the idea that companies which successfully fundraise are likely more valuable, this quarterly graduation rate becomes incredibly useful:
If X% of Seed startups graduate to Series A in a particular quarter, those companies loosely represent the top X% of Seed startups, ranked by true valuation. Their Series A price tells us something about the top of the Seed distribution.
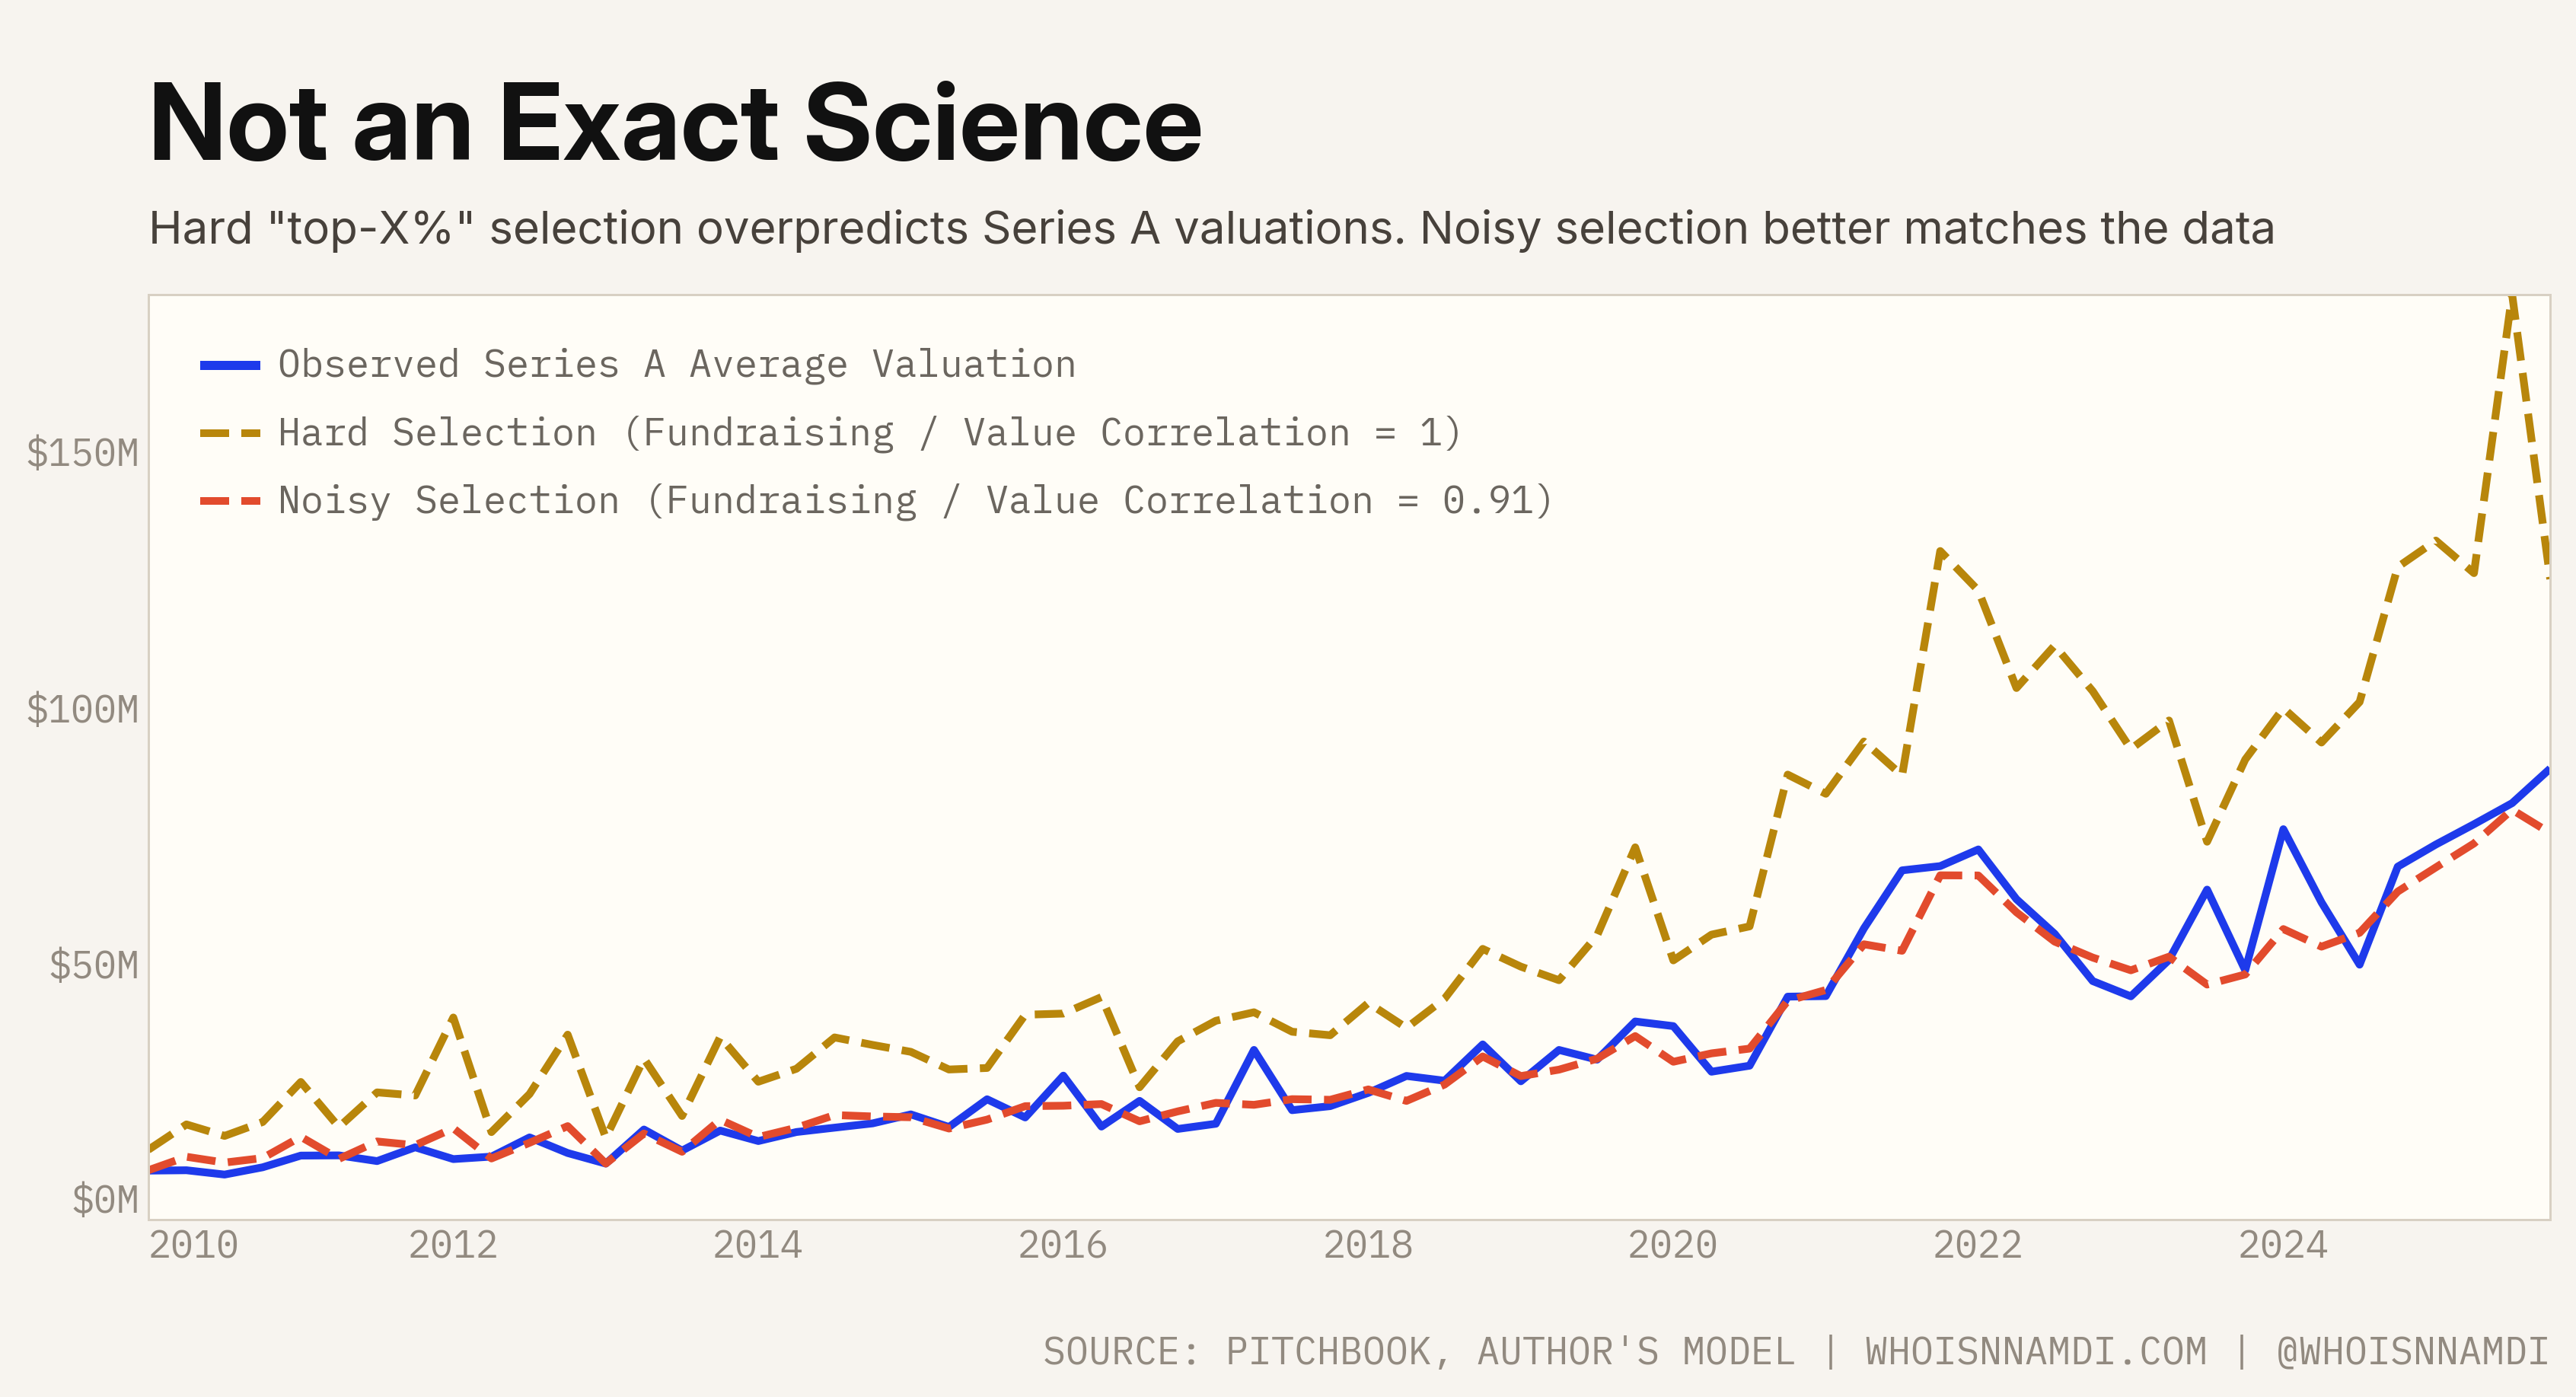
However, Series A investors don't line up every Seed company by valuation and draw a clean cutoff. Fundraising also depends on market, the heat around certain themes, timing, and other characteristics.
This matters empirically: if I assume Series A rounds go to the top slice of Seed startups only, the model over-predicts average Series A valuations.
Instead, I assume valuation affects the odds of raising, but selection is noisy. Put differently, in the calibrated model Series A investors mostly select from the upper tail, but not in exact rank order.
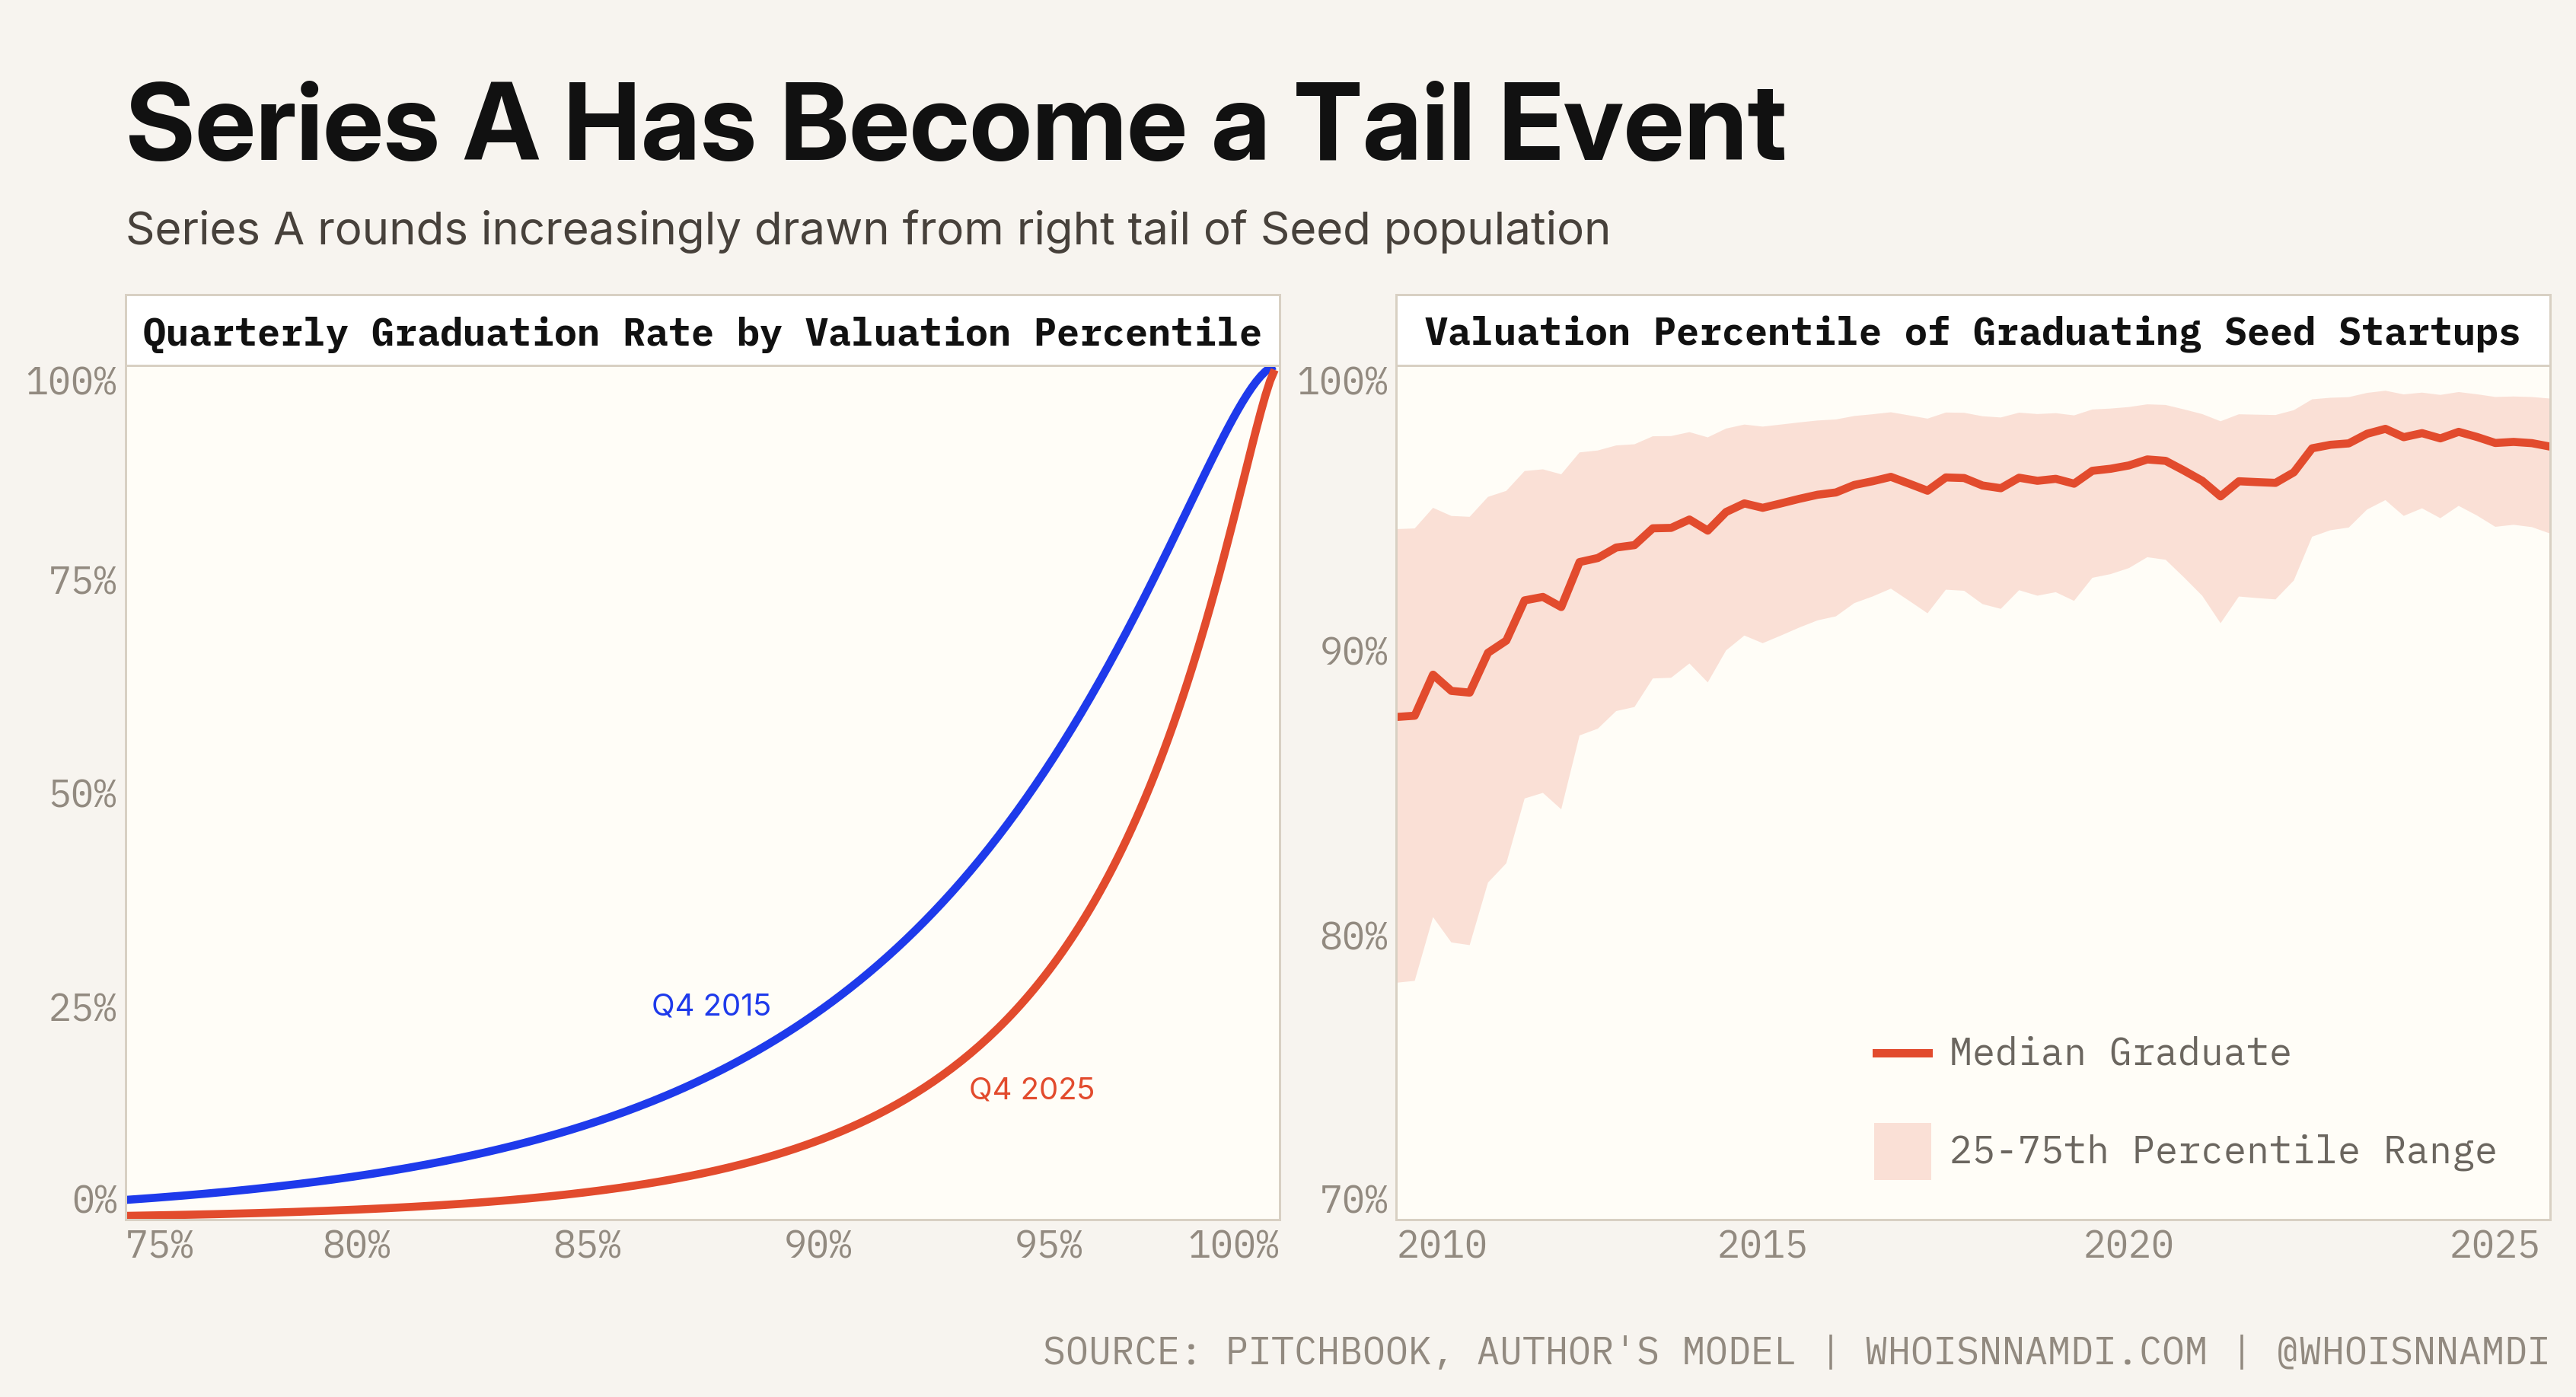
All of that machinery lets us estimate the probability of successfully raising Series A across various Seed valuation percentiles.
Using Q4 2015 and Q4 2025 as examples, we can see how over that decade the probability of graduating fell across the distribution:
From a coin flip to a 1-in-4 shot: Since 2015, the chance of a 95th percentile Seed startup successfully raising Series A in a given quarter has halved from 50% to ~25%
Going back further to the early 2010s, we see that the median startup graduating to Series A came from the top 10–15% of active Seed companies by valuation; it now comes from the top 3%.
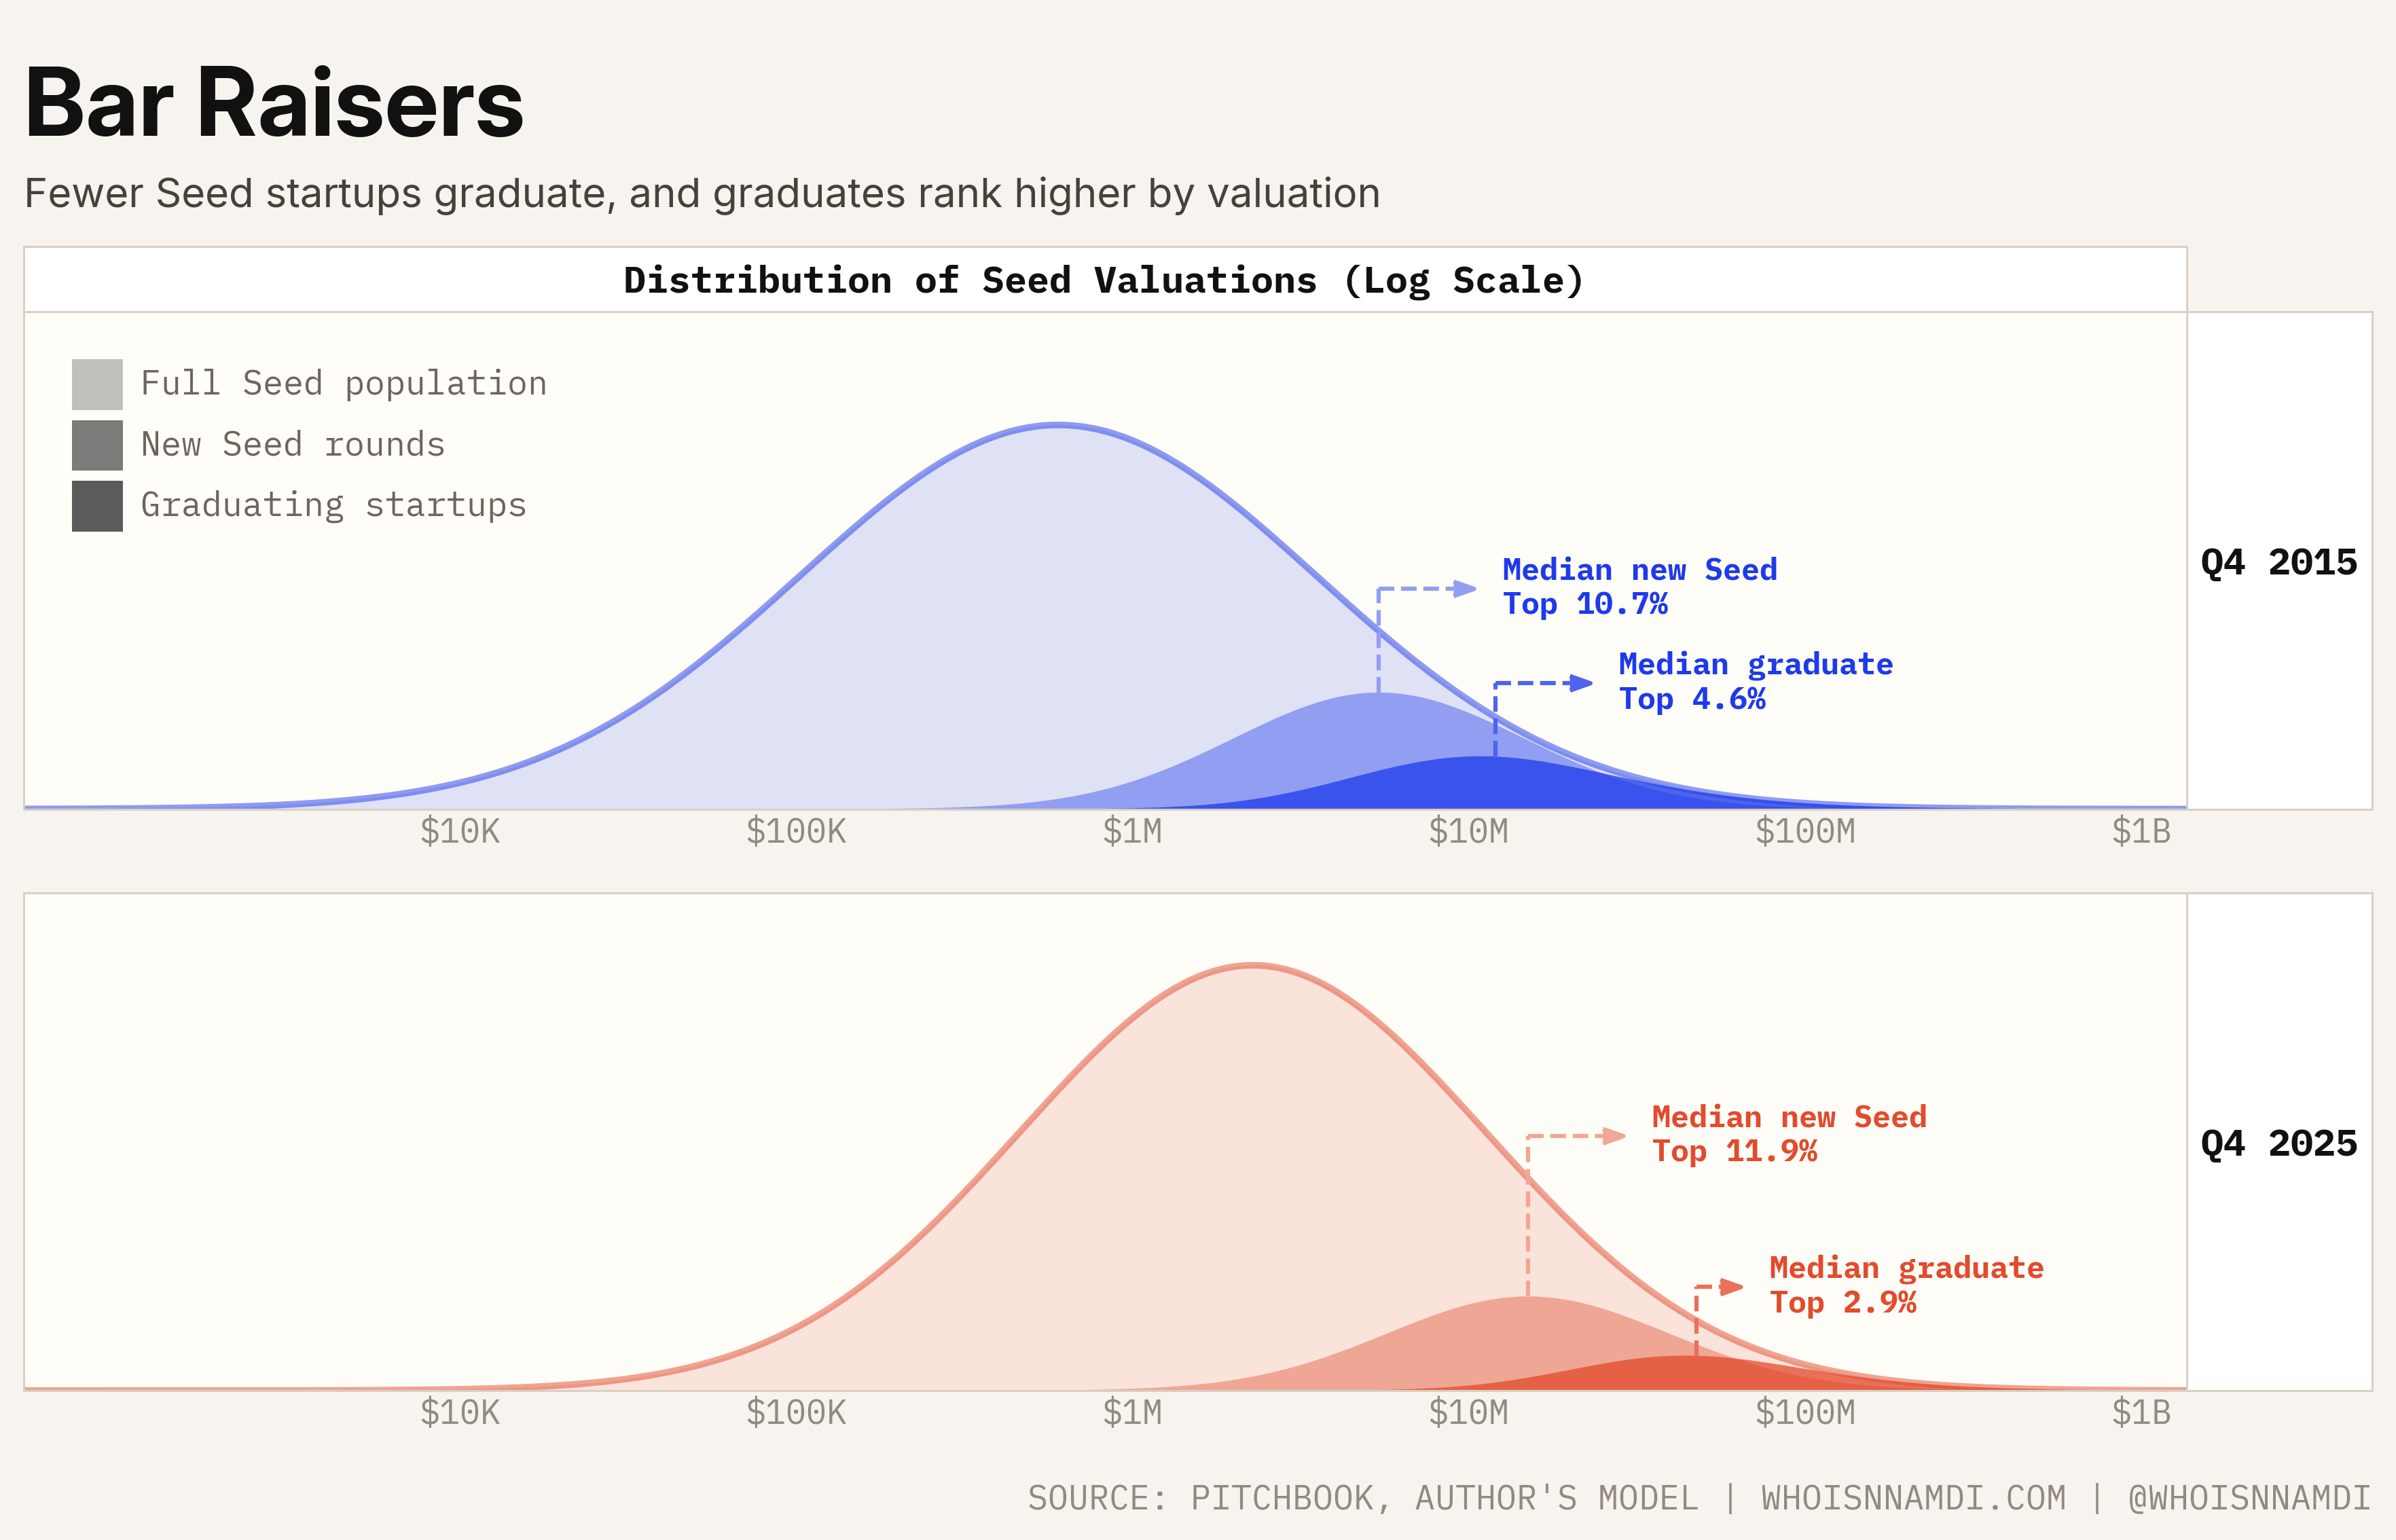
Here's another view. We know what proportion of Seed companies graduated, and we know the average valuation at which they raised Series A. Knowing the valuation of (roughly) the top X% of Seed startups, along with an assumption about the shape of the valuation distribution (log-normal), lets us infer what the rest of active Seed startups are worth:
The largest, lightest curve is the broader Seed population. The mid-shade curve is that quarter's newly minted Seeds. The smallest, darkest curve is the small group that raised Series A that quarter.
Graduating Seeds are of course much more valuable than the rest, but even new Seeds have substantially higher valuations than existing Seed startups.
New Seed-stage startups sprout with much enthusiasm and energy but either quickly grow into the next phase, or, as with most, slowly wither away.
What's clear: the "financing market" is not representative of the underlying Seed population.
A selection-adjusted valuation index
Extend this across every quarter and we get what we were after: the value of the average Seed startup, adjusted for the selection bias in the Series A transactions used to infer it. A true Seed valuation index:
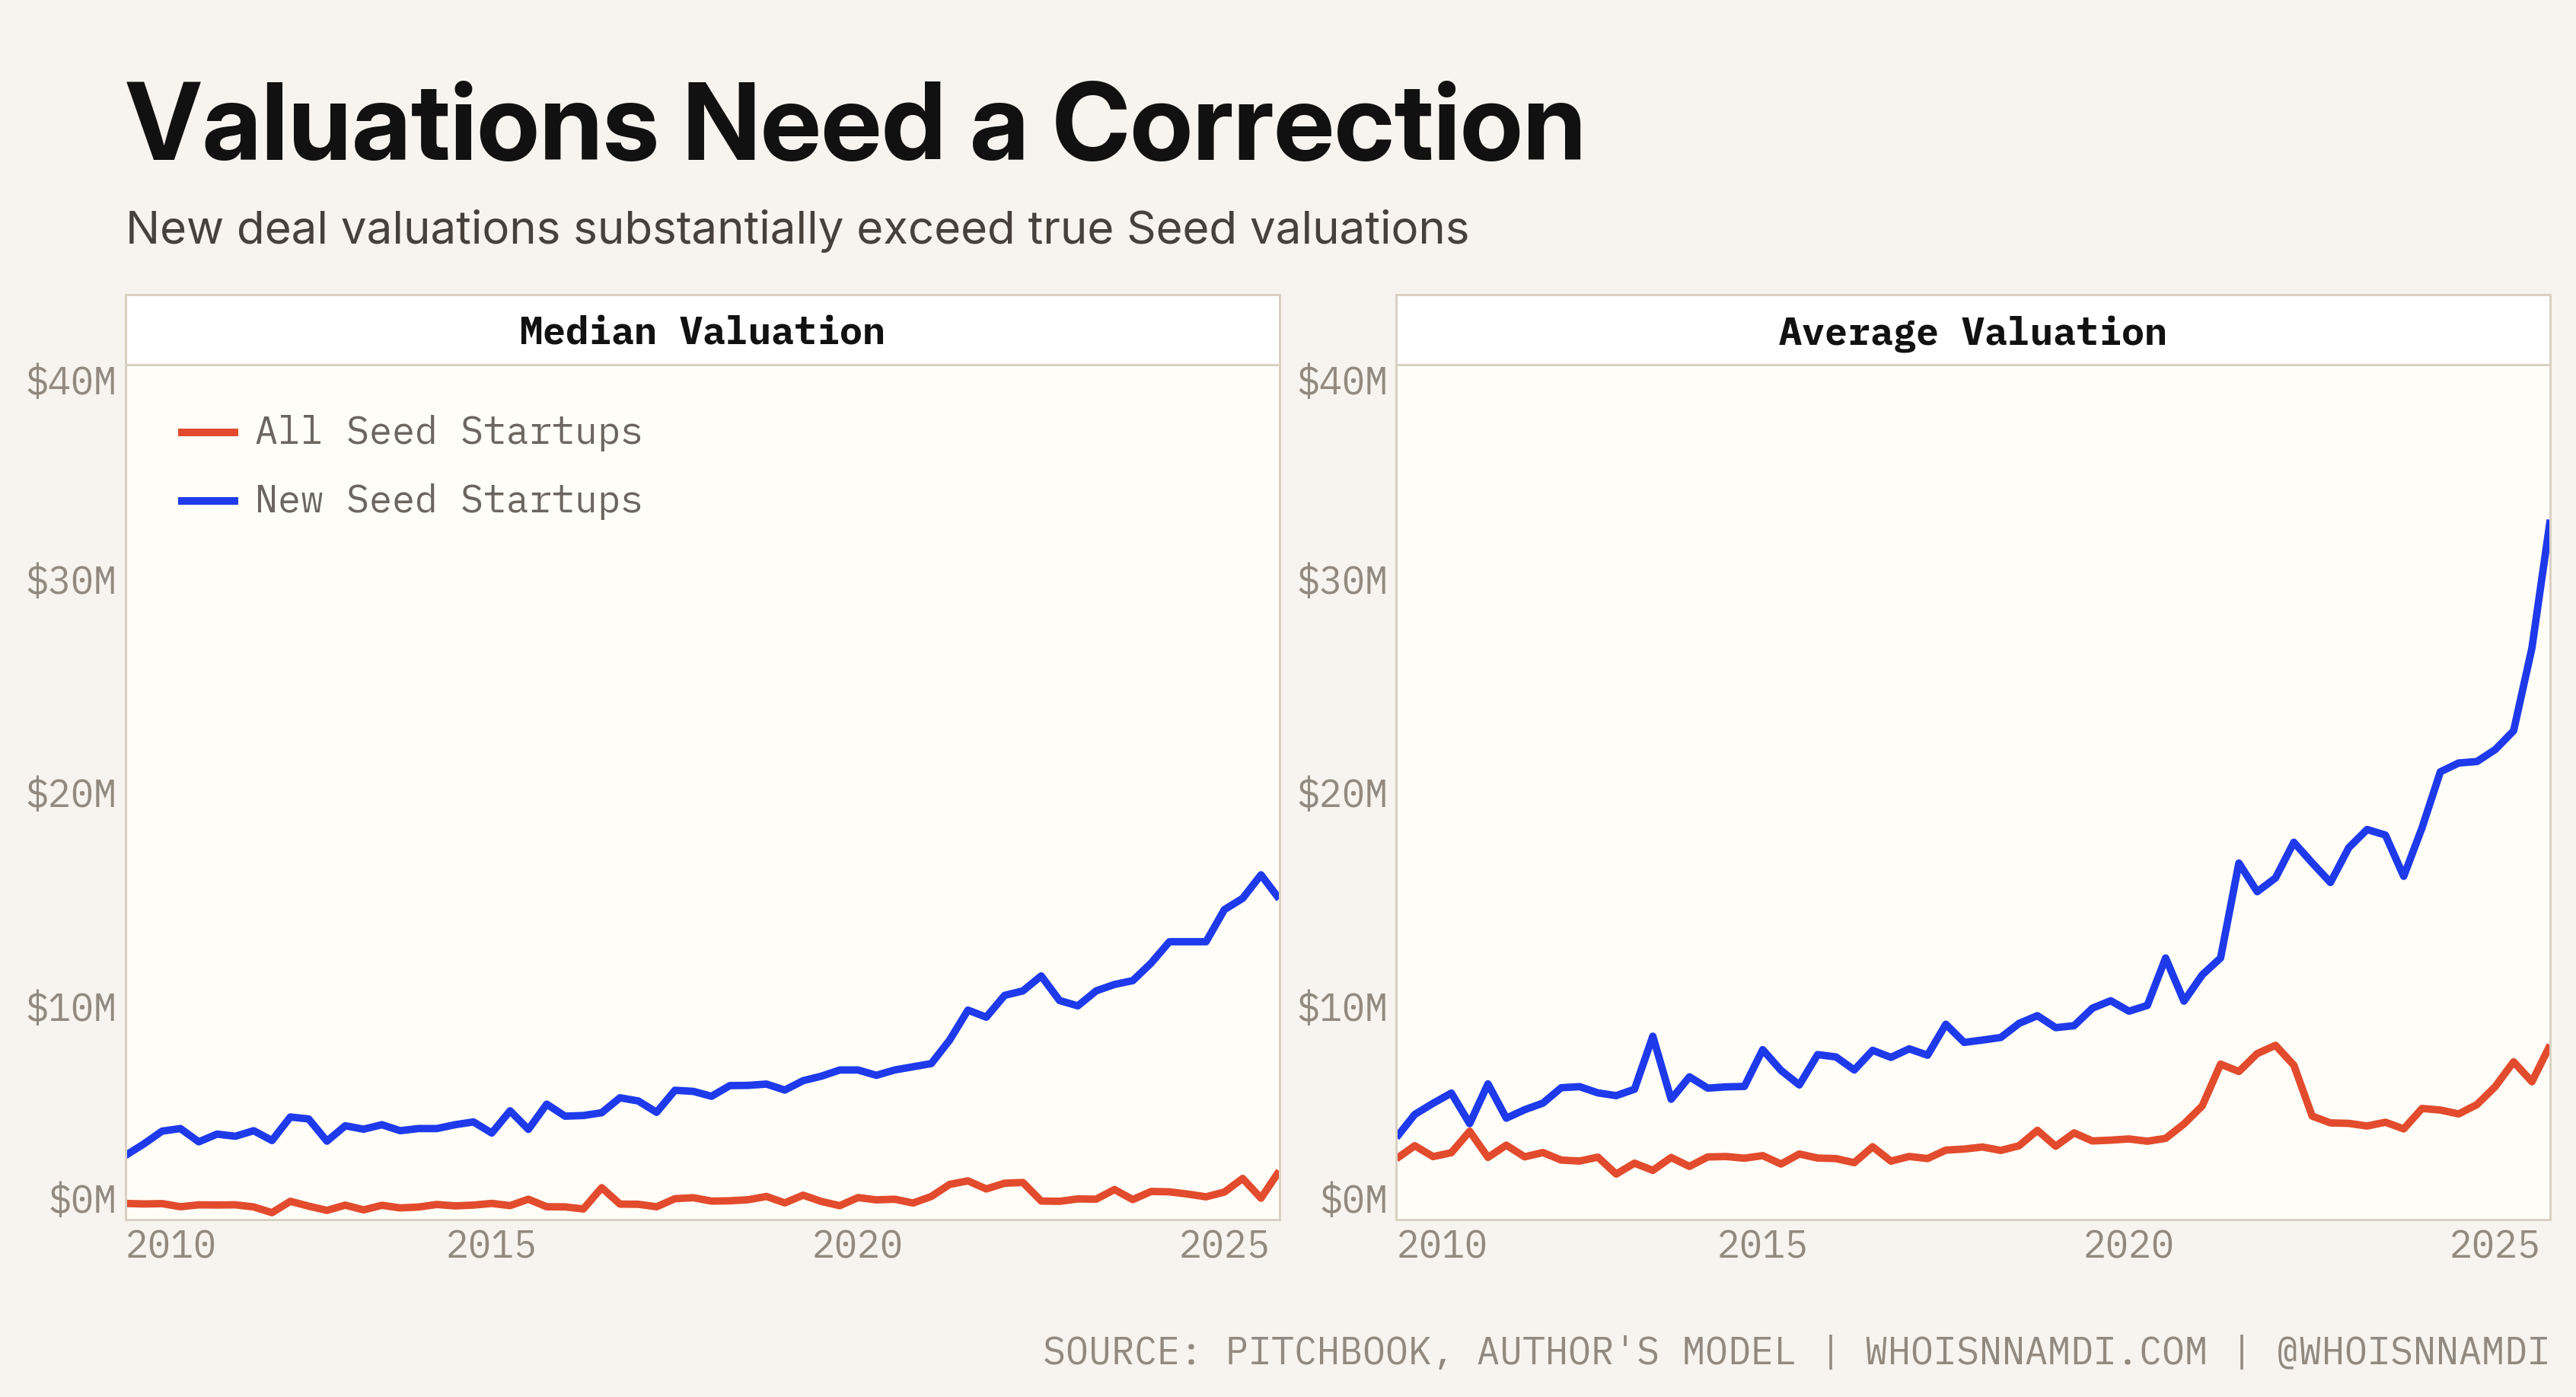
Here I compare the prices of new Seed deals (often seen as representing the current "Seed market") vs. our index, representing the average valuation of all existing Seed startups
Despite the headlines, until recently the median Seed startup wasn't worth more than ~$1M. Averages are higher ($3-4M historically) but still substantially subdued for existing relative to new Seed startups.
On a relative basis, new Seed financings are valued at four times the average and ten times the median existing Seed startup.
Deal valuations are a horrible proxy for the broader market. Ironically, though I use the tail of the distribution to infer the body, for the median Seed startup out there, the most eye-popping numbers you hear are essentially irrelevant to what your own company might be worth. You could imagine similar discrepancies at other stages of venture capital.
Breaking down the selection bias:
Selection: only 4% of Seed startups graduate quarterly
Bias: yet those graduates account for 45% of the value of all Seed-stage startups
Notably, both the "share of value" and the "share of companies" have fallen over time, but the graduating share of companies has fallen by much more, implying the overall selection bias has magnified. These trends explain the rightmost panel: the average Series A financing has grown from 3x the average "true" valuation among all Seed startups in 2010 to 12x as of 2025.
It's always been the case that the winners at the early stage generate disproportionate gains, but the winner's circle is a decidedly more exclusive club today.
The (Seed) stock market
Now for the grand finale.
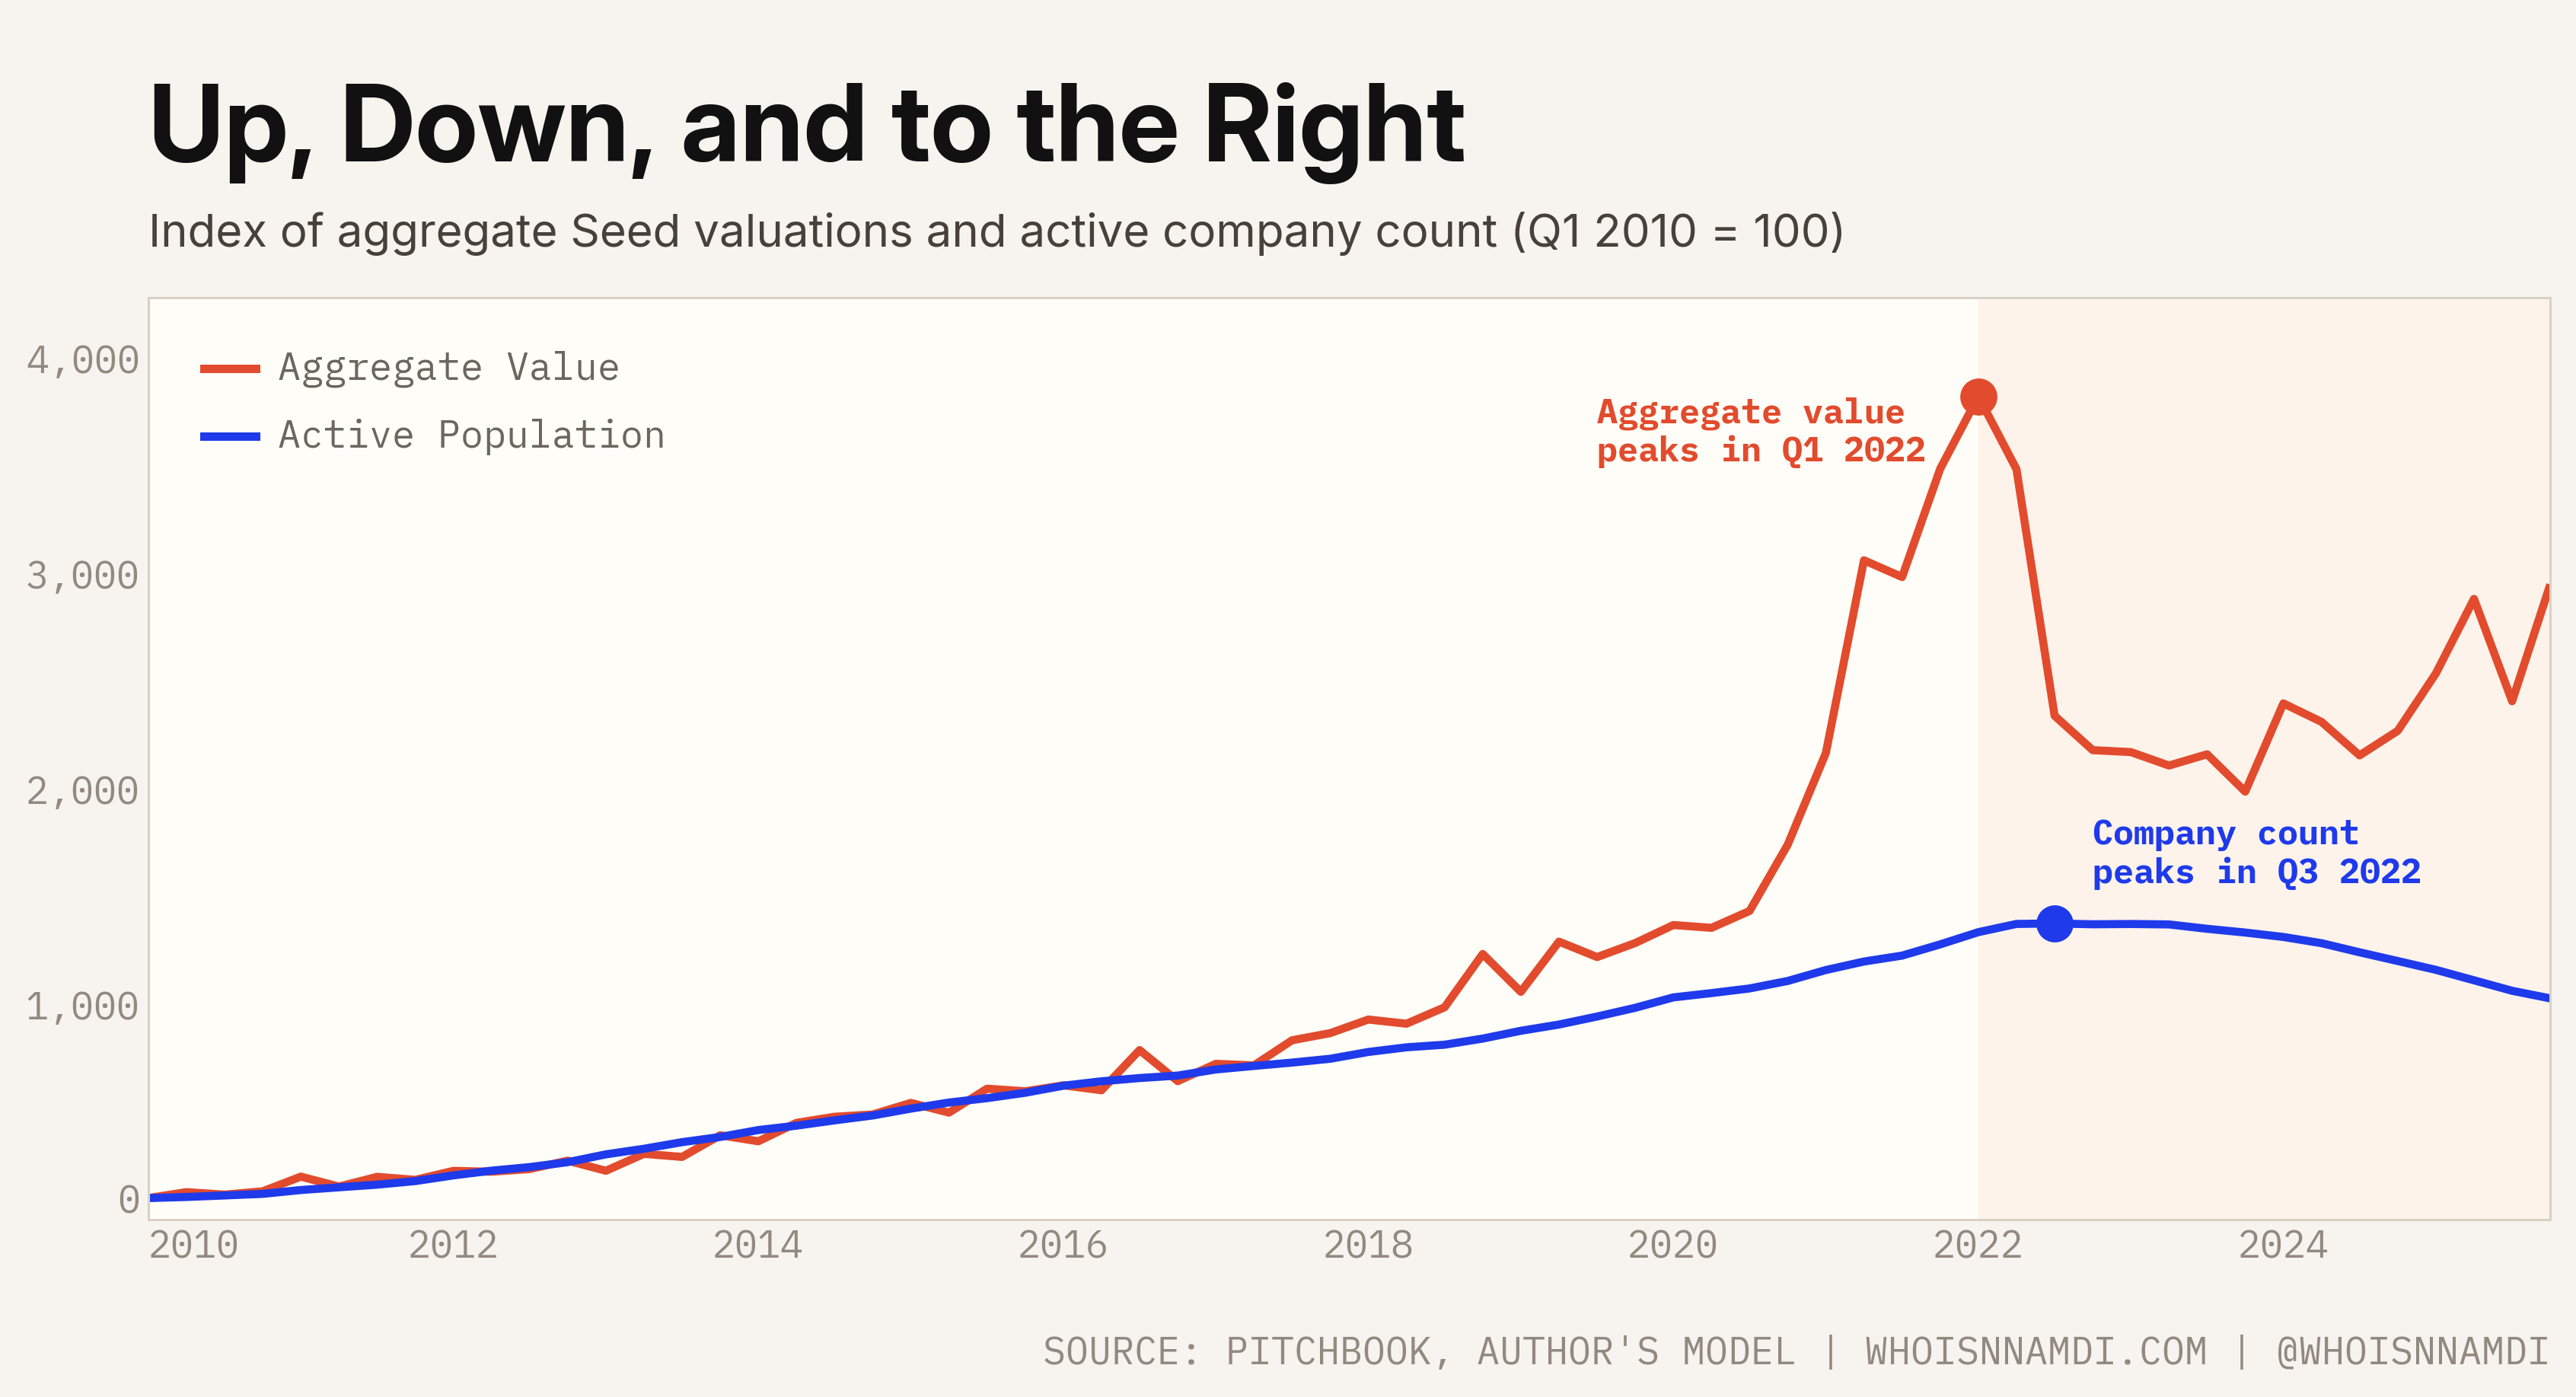
We have both prices (the latent valuations I estimated earlier) and quantities (the total Seed stock I estimated in part 1), so we can calculate the aggregate value or market capitalization of the entire Seed ecosystem. For comparison, I'll plot it against the underlying active Seed count:
From 2010 to 2017, the two lines are essentially one, with company count and total valuation growing proportionately.
Then they diverge. Value exploded during the 2021 boom, corrected afterward, and partially recovered. The Seed population peaked in 2022 and contracted ever since. In that sense, the market cap recovery is purely valuation-driven.
Caveats apply: I've estimated two separate quantities and then multiplied them together, so any errors compound.
That said, intuitively it feels unhealthy that prices (valuations) are up while quantities (active Seed startups) are down. The index continues to climb, while value is concentrated in a smaller group of companies. Where have I heard thatstory before?
The seen and the unseen
You can fool some of the people all of the time, and all of the people some of the time, but you cannot fool all of the people all of the time. – Abraham Lincoln (maybe)
We don't have the price of all the companies all the time, but we do have the price of some of the companies some of the time. I've used that to construct a more accurate, representative view of private valuations.
The key assumption: Series A rounds are a systematically selected sample of the active Seed population. They are higher-quality, higher-valued businesses. Therefore, the valuations we observe at Series A reveal information about the upper tail of Seed startups. This analysis works backward from that selected tail to infer the broader population statistics.
This logic leads to two distinct results:
First, new Series A deals are ~12 times the valuation of the average Seed startup, demonstrating extreme positive selection.
Second, actual Seed valuations are about one-quarter that of new Seed deals, showing how poor a benchmark new deals are for existing companies.
Here I focus on the Seed stage, but the same framework could be replicated across the other stages of venture capital.
Private valuations can look more expensive due to fewer, high-value companies transacting rather than a true, broad-based appreciation. The corrected Seed valuations I estimate here have not grown at the same pace as new deal valuations. Observed valuations have become less representative over time.
Footnotes
Technically, covariance rather than correlation. ↩
Join the Syndicate
Long-form essays on the economics of tech, with the data to back it up. All signal, no noise.
Read by 5,000+ founders, engineers, and investors.