Missing data
To make that claim, I needed a measure of the total number of seed stage companies that are “alive” at any moment. This is surprisingly difficult to locate, as no one tracks this.
This is understandable – companies announce their initial Seed financings, they might publicly celebrate their Series A funding, but they typically don't announce shut downs (ironic, given it's the most common outcome). They mostly just die off (“quiet quitting” as they say). When startups do announce an abrupt exit, databases like PitchBook don’t always record this, and even when they do you can't extract the data at an aggregate, "macro" level.
This creates a missing data problem. One can get around this, but it requires making assumptions about the way the world works that allow you to plausibly "guess" what the missing data looks like.
In this case, I needed to make assumptions about the graduation and “death” / exit rate of Seed stage companies. Knowing this, I could estimate the count of live Seed startups by adding up all the surviving companies across past and present Seed cohorts, estimated with those graduation and exit rates.
Observed flow
New Seed deals
Seed financings tell us which companies enter the population.
Partially observed
Graduations
Series A rounds reveal when Seed companies leave the Seed stage successfully.
Inferred flow
Exits and deaths
Shutdowns and small acquisitions are usually quiet, so they have to be modeled.
Graduation statistics
Thankfully, there is some data out there on graduation rates that I can leverage in multiple ways.
I’ve previously discussed the shifting winds around the graduation of Seed stage companies to Series A, particularly after the 2021 boom period:
... the numerous startups that raised Seed funding during the boom are now facing a massive bust... It's safe to say the graduation or survival rate from Seed to A has fallen by more than half. -- The Series A Bust
This has been well-documented by multiple sources:
The percentage of companies who make it from seed to Series A within two years fell by a lot for the 2021 seed cohort.
27.5% of companies that raised a seed round in 2019 made it to Series A within 2 years.
Only 17.6% of companies who raised their seed in 2021 have "graduated" to the next round. – Peter Walker (Carta)
It’s hard to believe today, but at some point in the not-too-distant past over 50% of Seed stage companies “graduated” to Series A. That’s unthinkable these days, as most recent Seed cohorts are trending well below that:
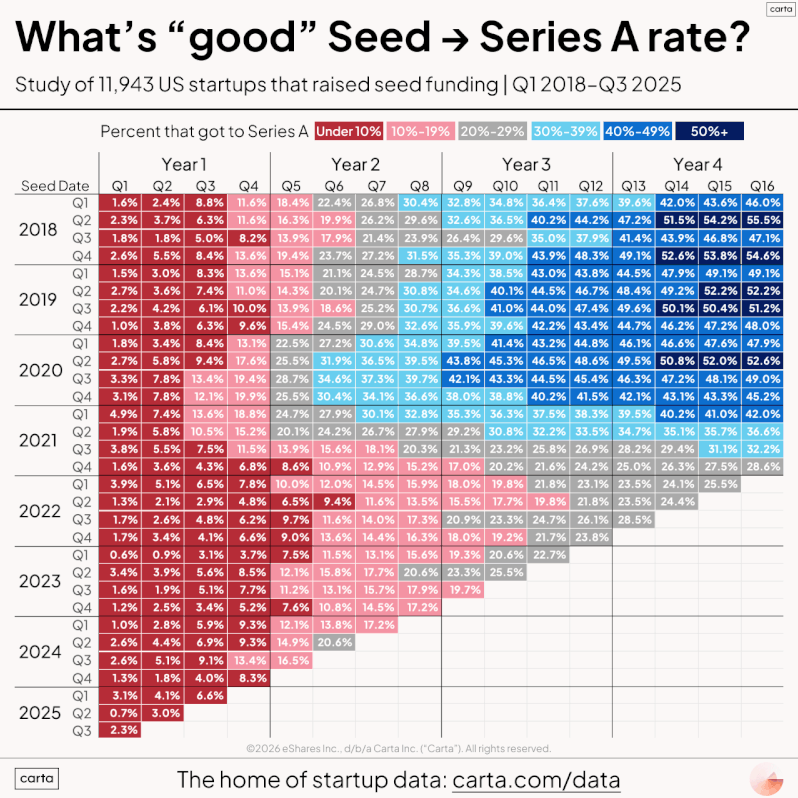
I fit S-curves to various benchmarks of Seed conversion to Series A. That part was easy enough (and yes I realize they don’t start right at zero, this was hard to enforce for various technical reasons):
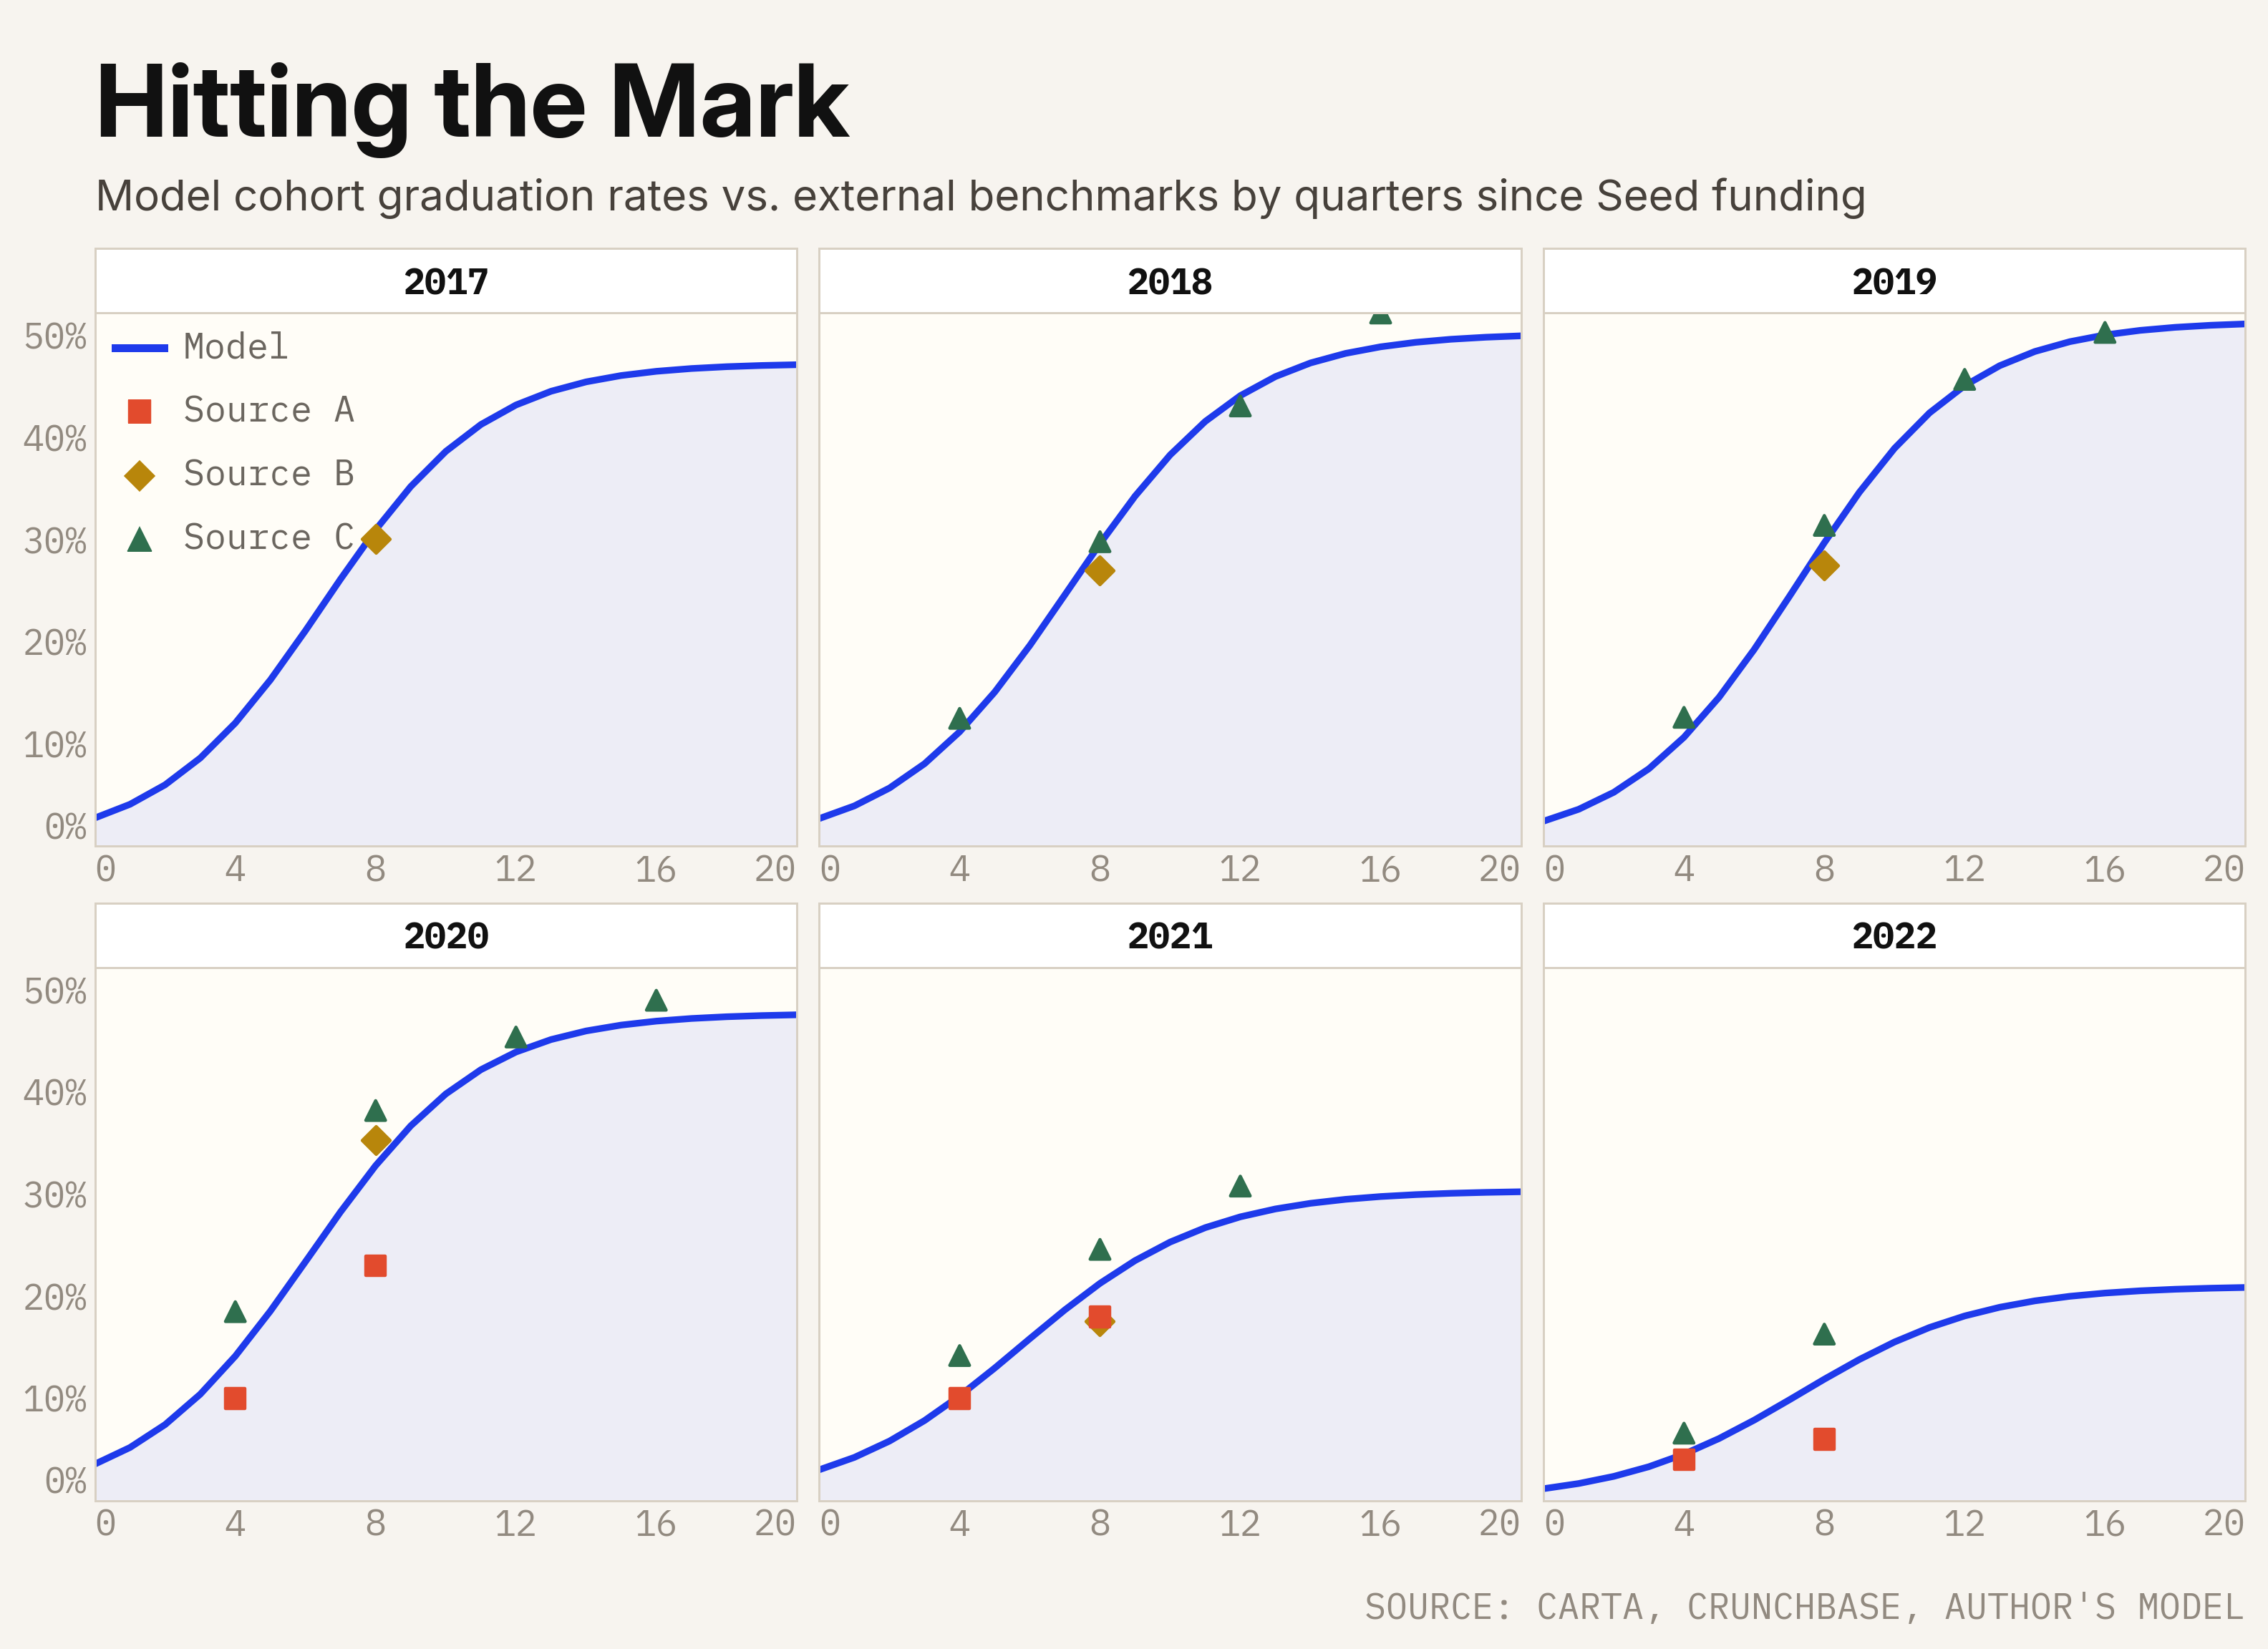
However, I also needed two more things:
- something to inform the earlier Seed cohorts that Carta and other sources don’t publish, and
- some way to ground this in the Series A data, most of which represents Seed companies graduating to the next stage.
In other words, the number of graduations our model estimates should correspond to the quantity of Series A deals getting done.
I assume that all Series As “come from” a Seed company that was part of a prior cohort. This is not exactly true: some companies go straight to Series A as their first round of funding. This was more common in the distant past than it is today. So I’m cheating here slightly to keep things simple, but I think it’s fine.
I embedded this in a larger statistical model that estimates the evolution of Seed graduation curves over time, matching both the benchmarks but also the aggregate data on Series A deals. In effect, I backed into the underlying cohorts at the micro level that are driving aggregate deal counts at the macro level. I constrained neighboring cohorts to be “similar” in their behavior, to avoid overfitting the data and ending up with erratic shifts between cohorts.
| Input |
Status |
Role in the model |
Main caveat |
| Seed deal counts |
Observed |
Defines the inflow of companies entering the Seed stock |
Data coverage is never perfect |
| Series A deal counts |
Observed |
Validates that modeled graduations reconcile with macro activity |
Some companies still skip Seed and start at Series A |
| Graduation rate |
Benchmarked |
Anchors the shape of Seed-to-Series-A curves |
Public benchmarks are sparse and uneven across cohorts |
| Shutdowns / Acquisitions |
Inferred |
Completes the outflow side of the stock-flow account |
Shutdowns are quiet, so timing has to be assumed |
It’s not perfect, but I was able to get a pretty good fit to the aggregate data without any obvious overfitting:
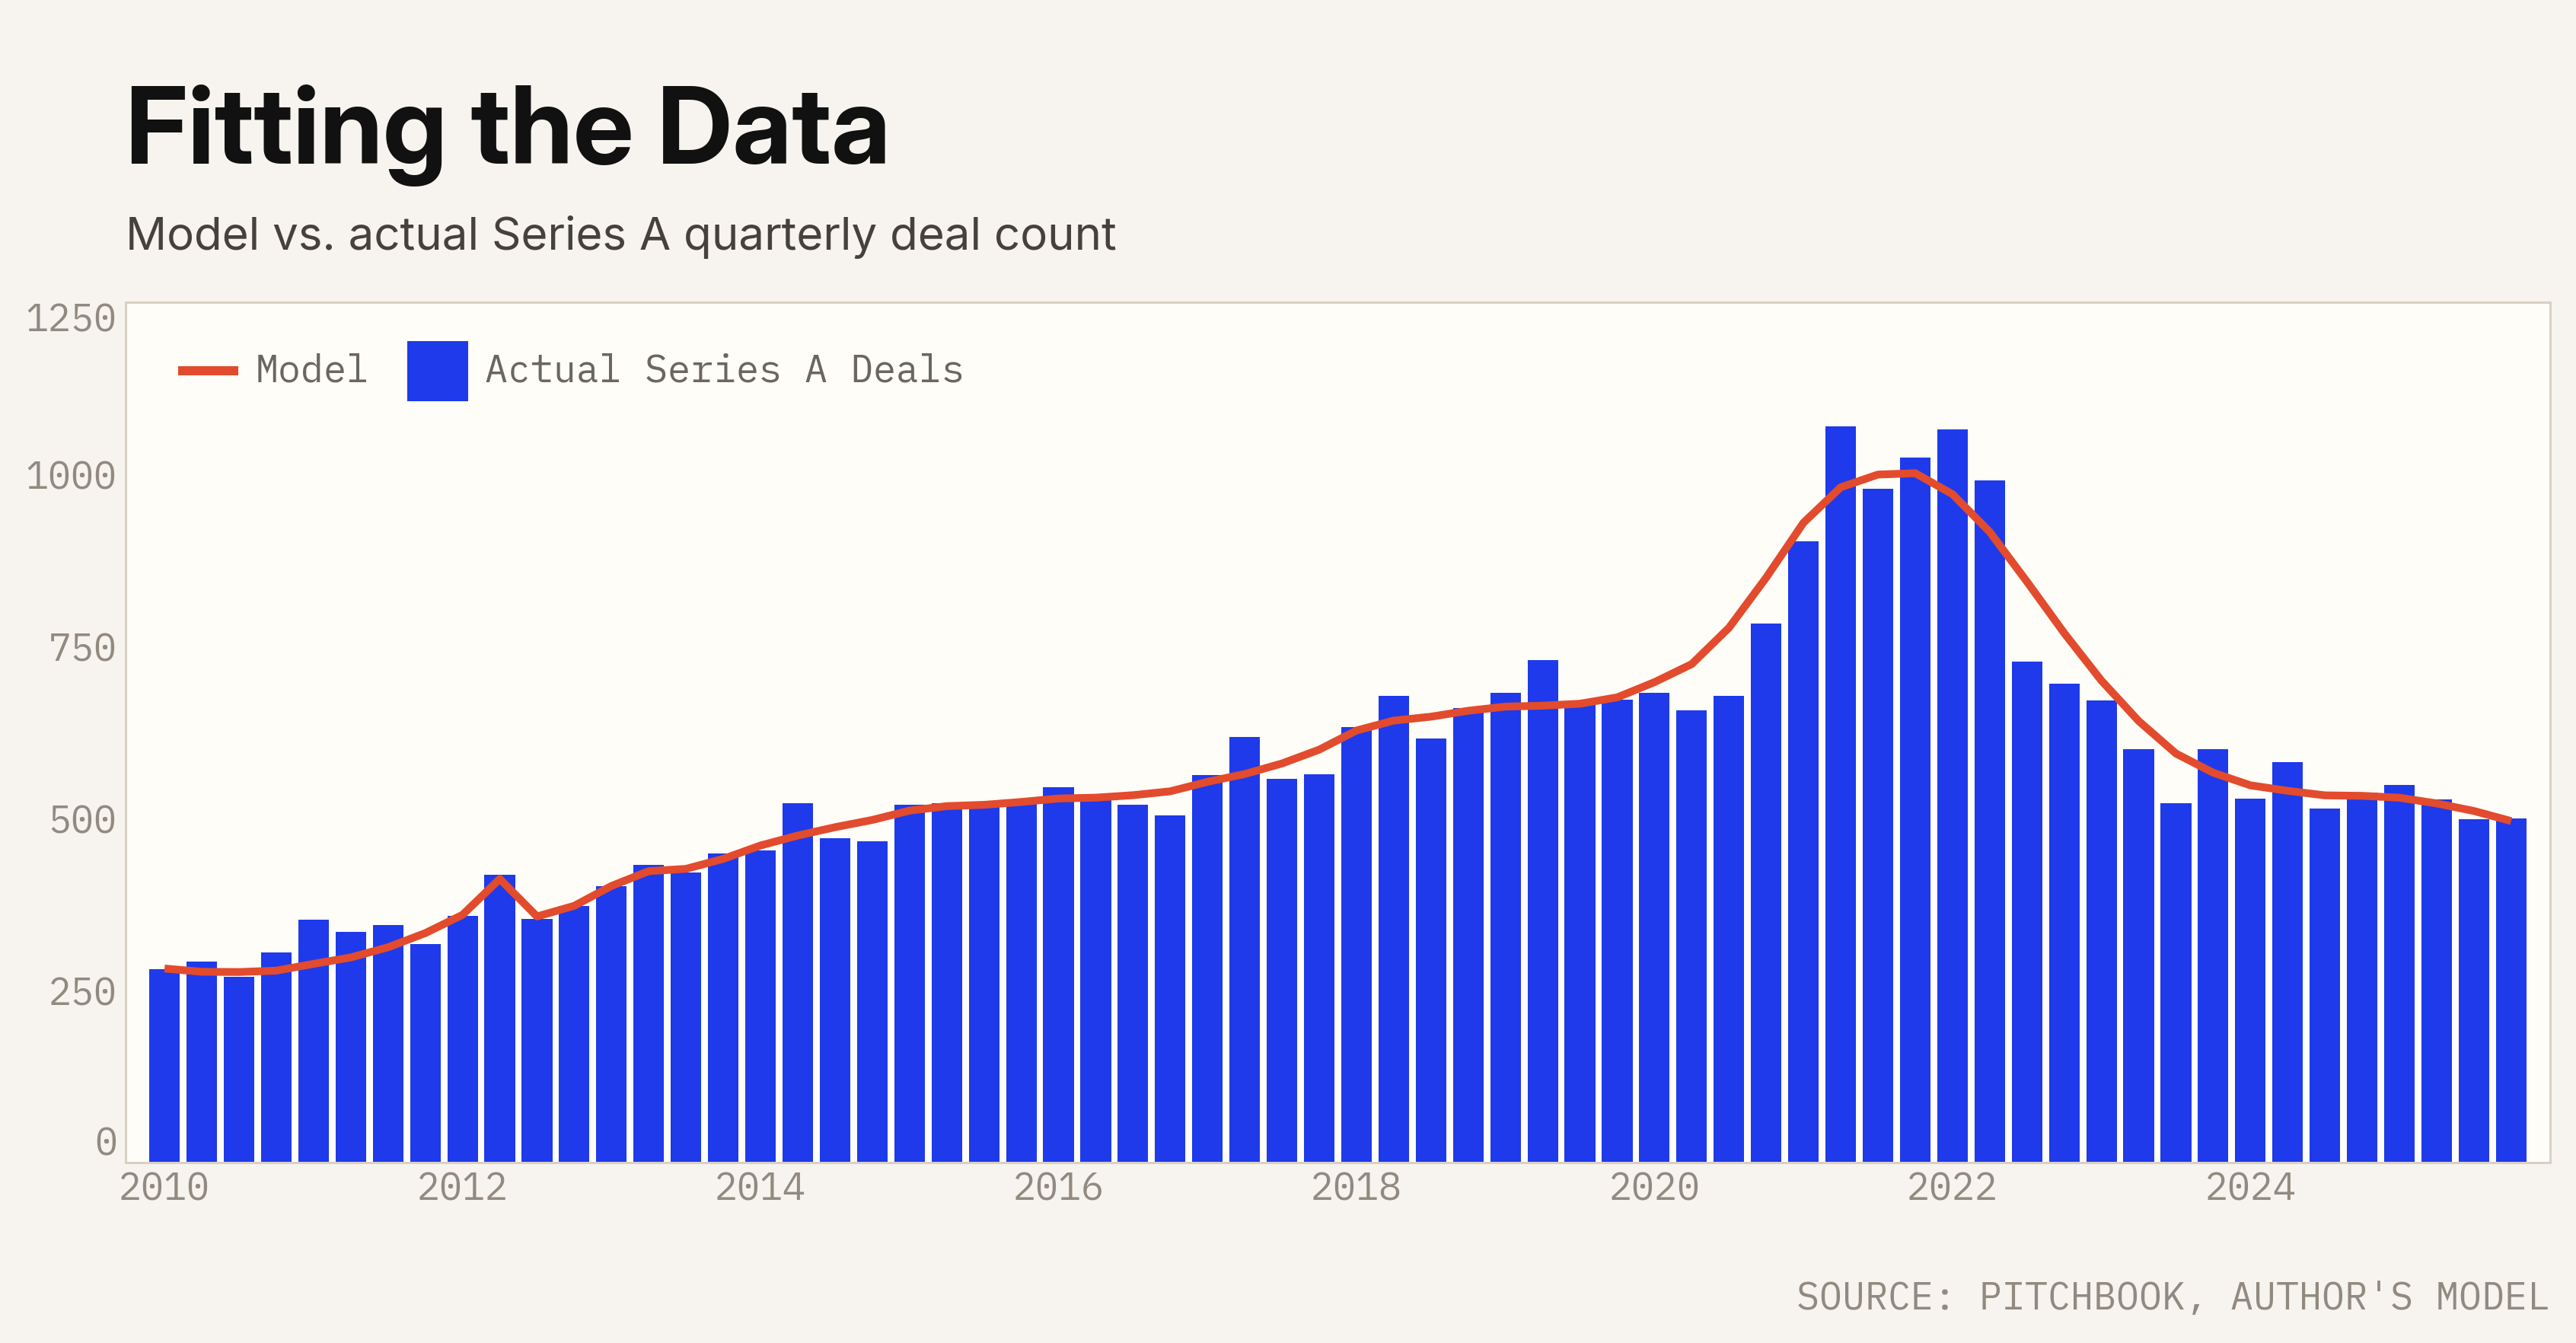
Doing this reveals some interesting dynamics in the underlying cohort data that are worth highlighting.
First, the graduation rate. More exactly: the eventual proportion of Seed companies in a given (quarterly) cohort that will graduate to Series A. We can see below how that has trended over time – reasonably stable through early 2020 before suddenly falling off a cliff:
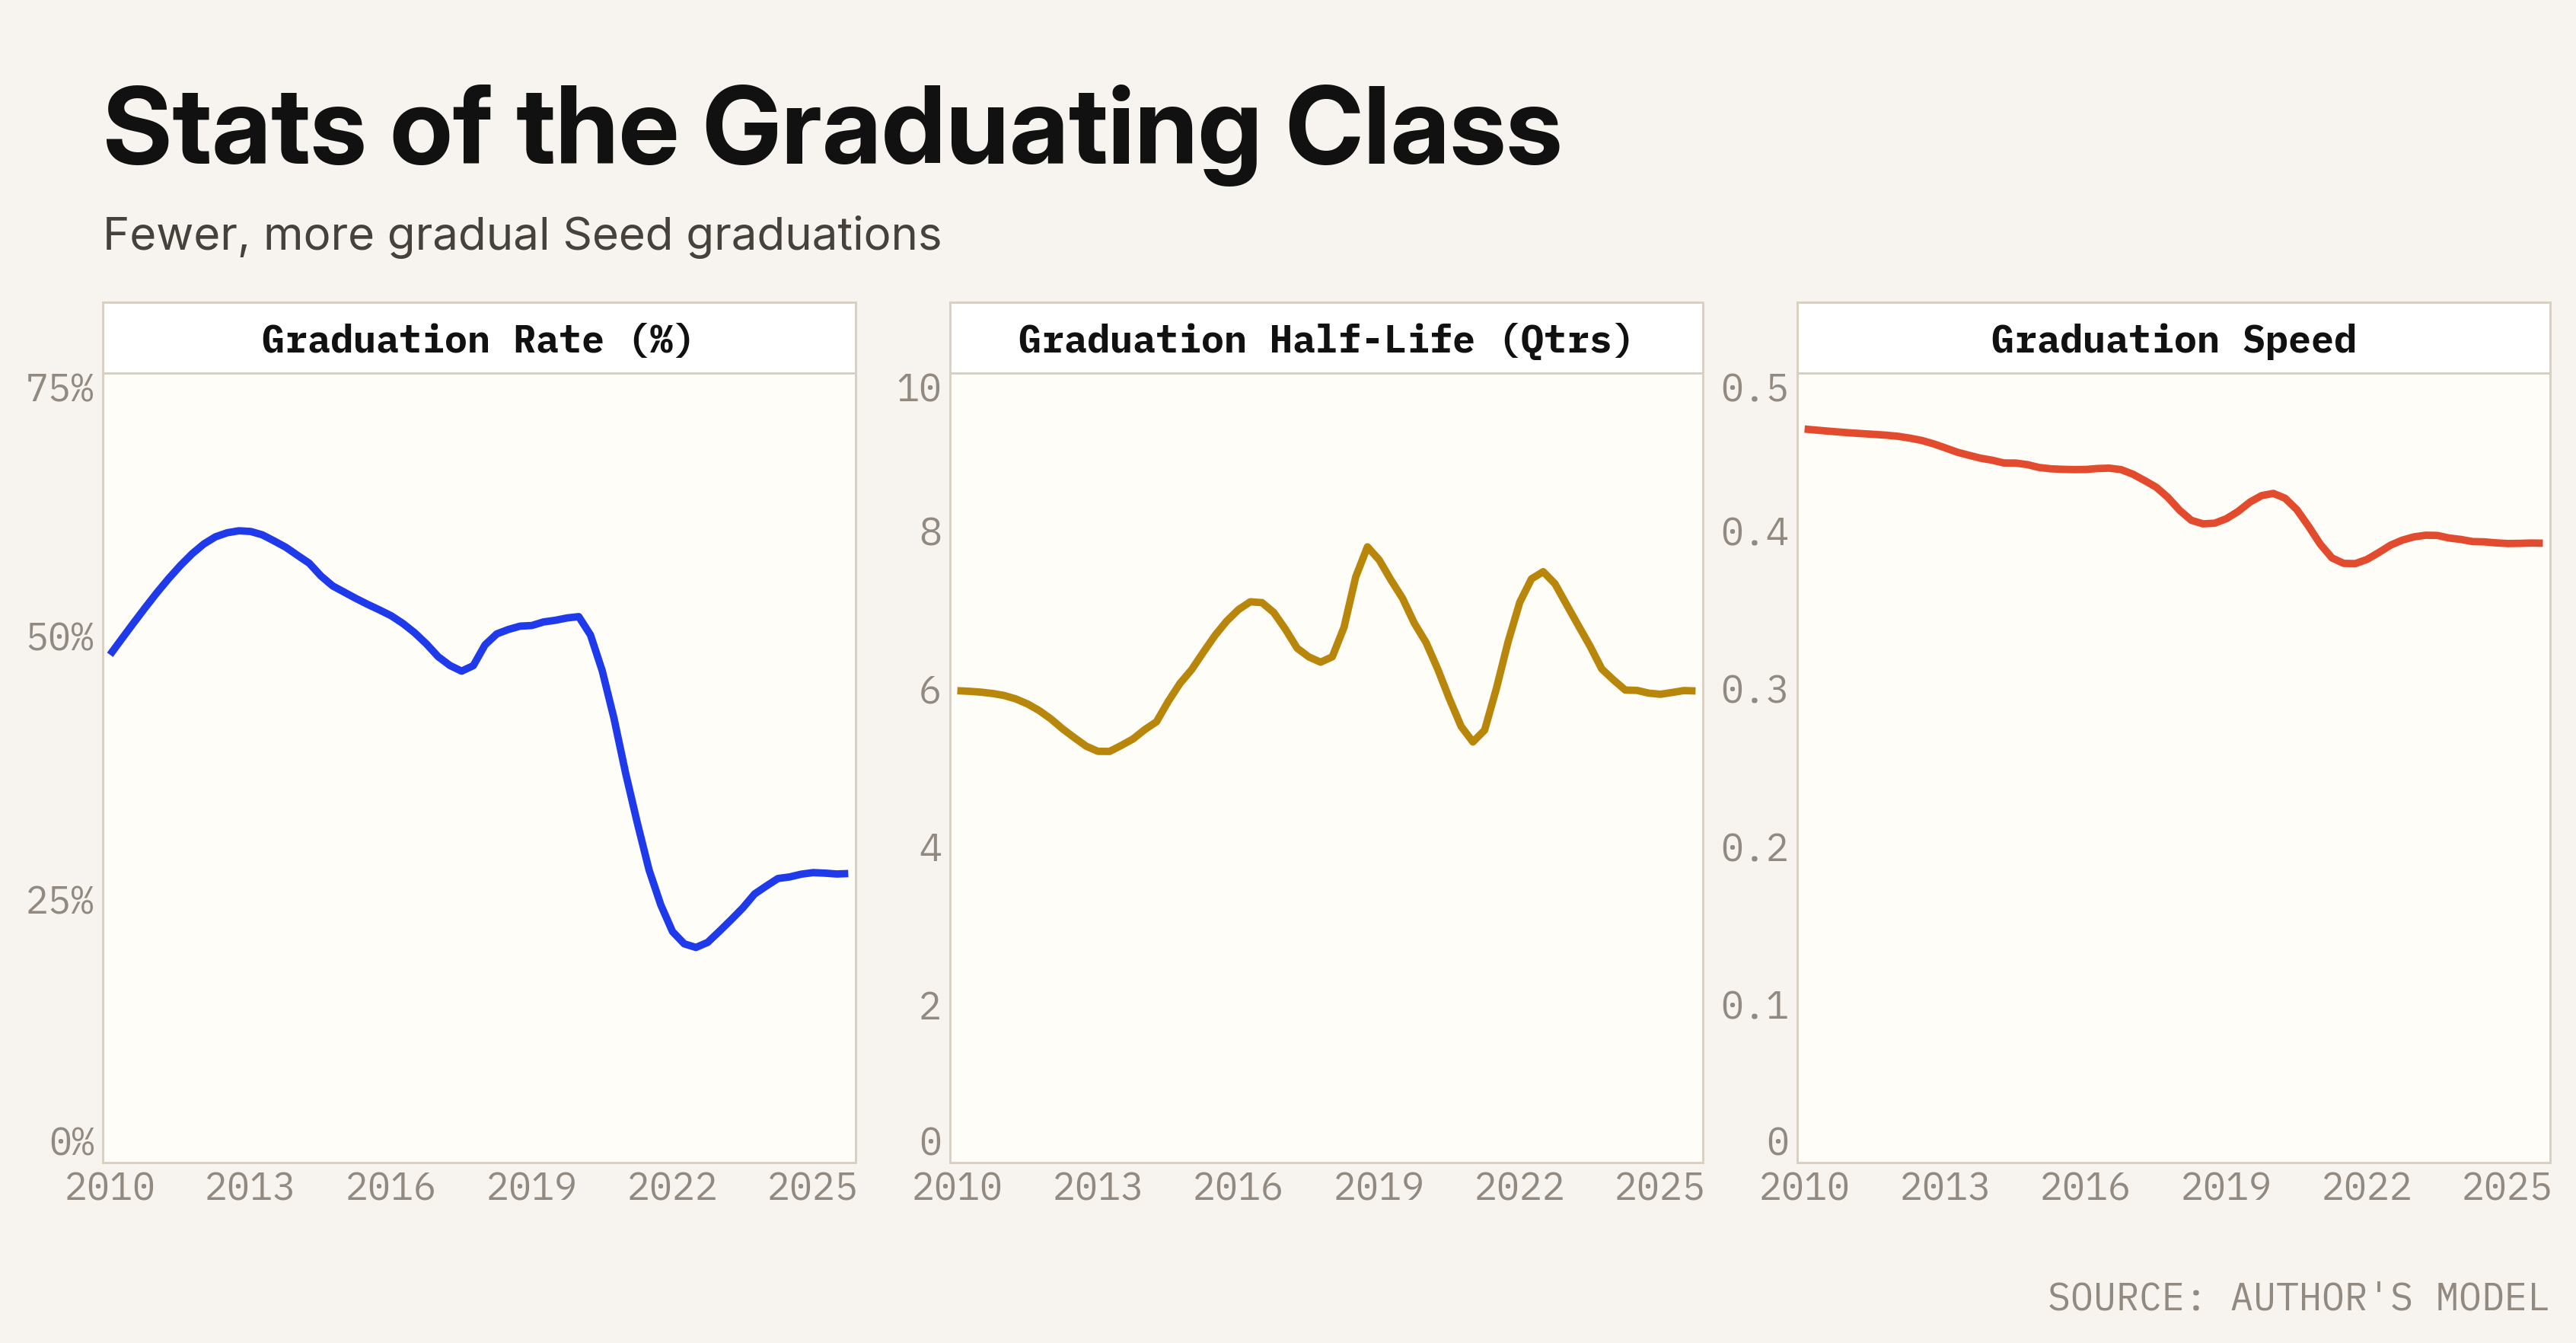
From the model I can also estimate the “half-life” of a cohort – the time it takes for 50% of the eventual graduations to occur. This has been mostly stable over time, hovering in the 6-8 quarter range throughout the past 15 years. Not much action here.
Lastly, I estimate how quickly the graduation inflection and eventual saturation happen, with higher “speed” implying more aggressive curvature of the S-curves. The graduation curves have trended more gradual, moderating over time (don’t bother trying to interpret the units).
Here are my estimated cohort graduation curves:
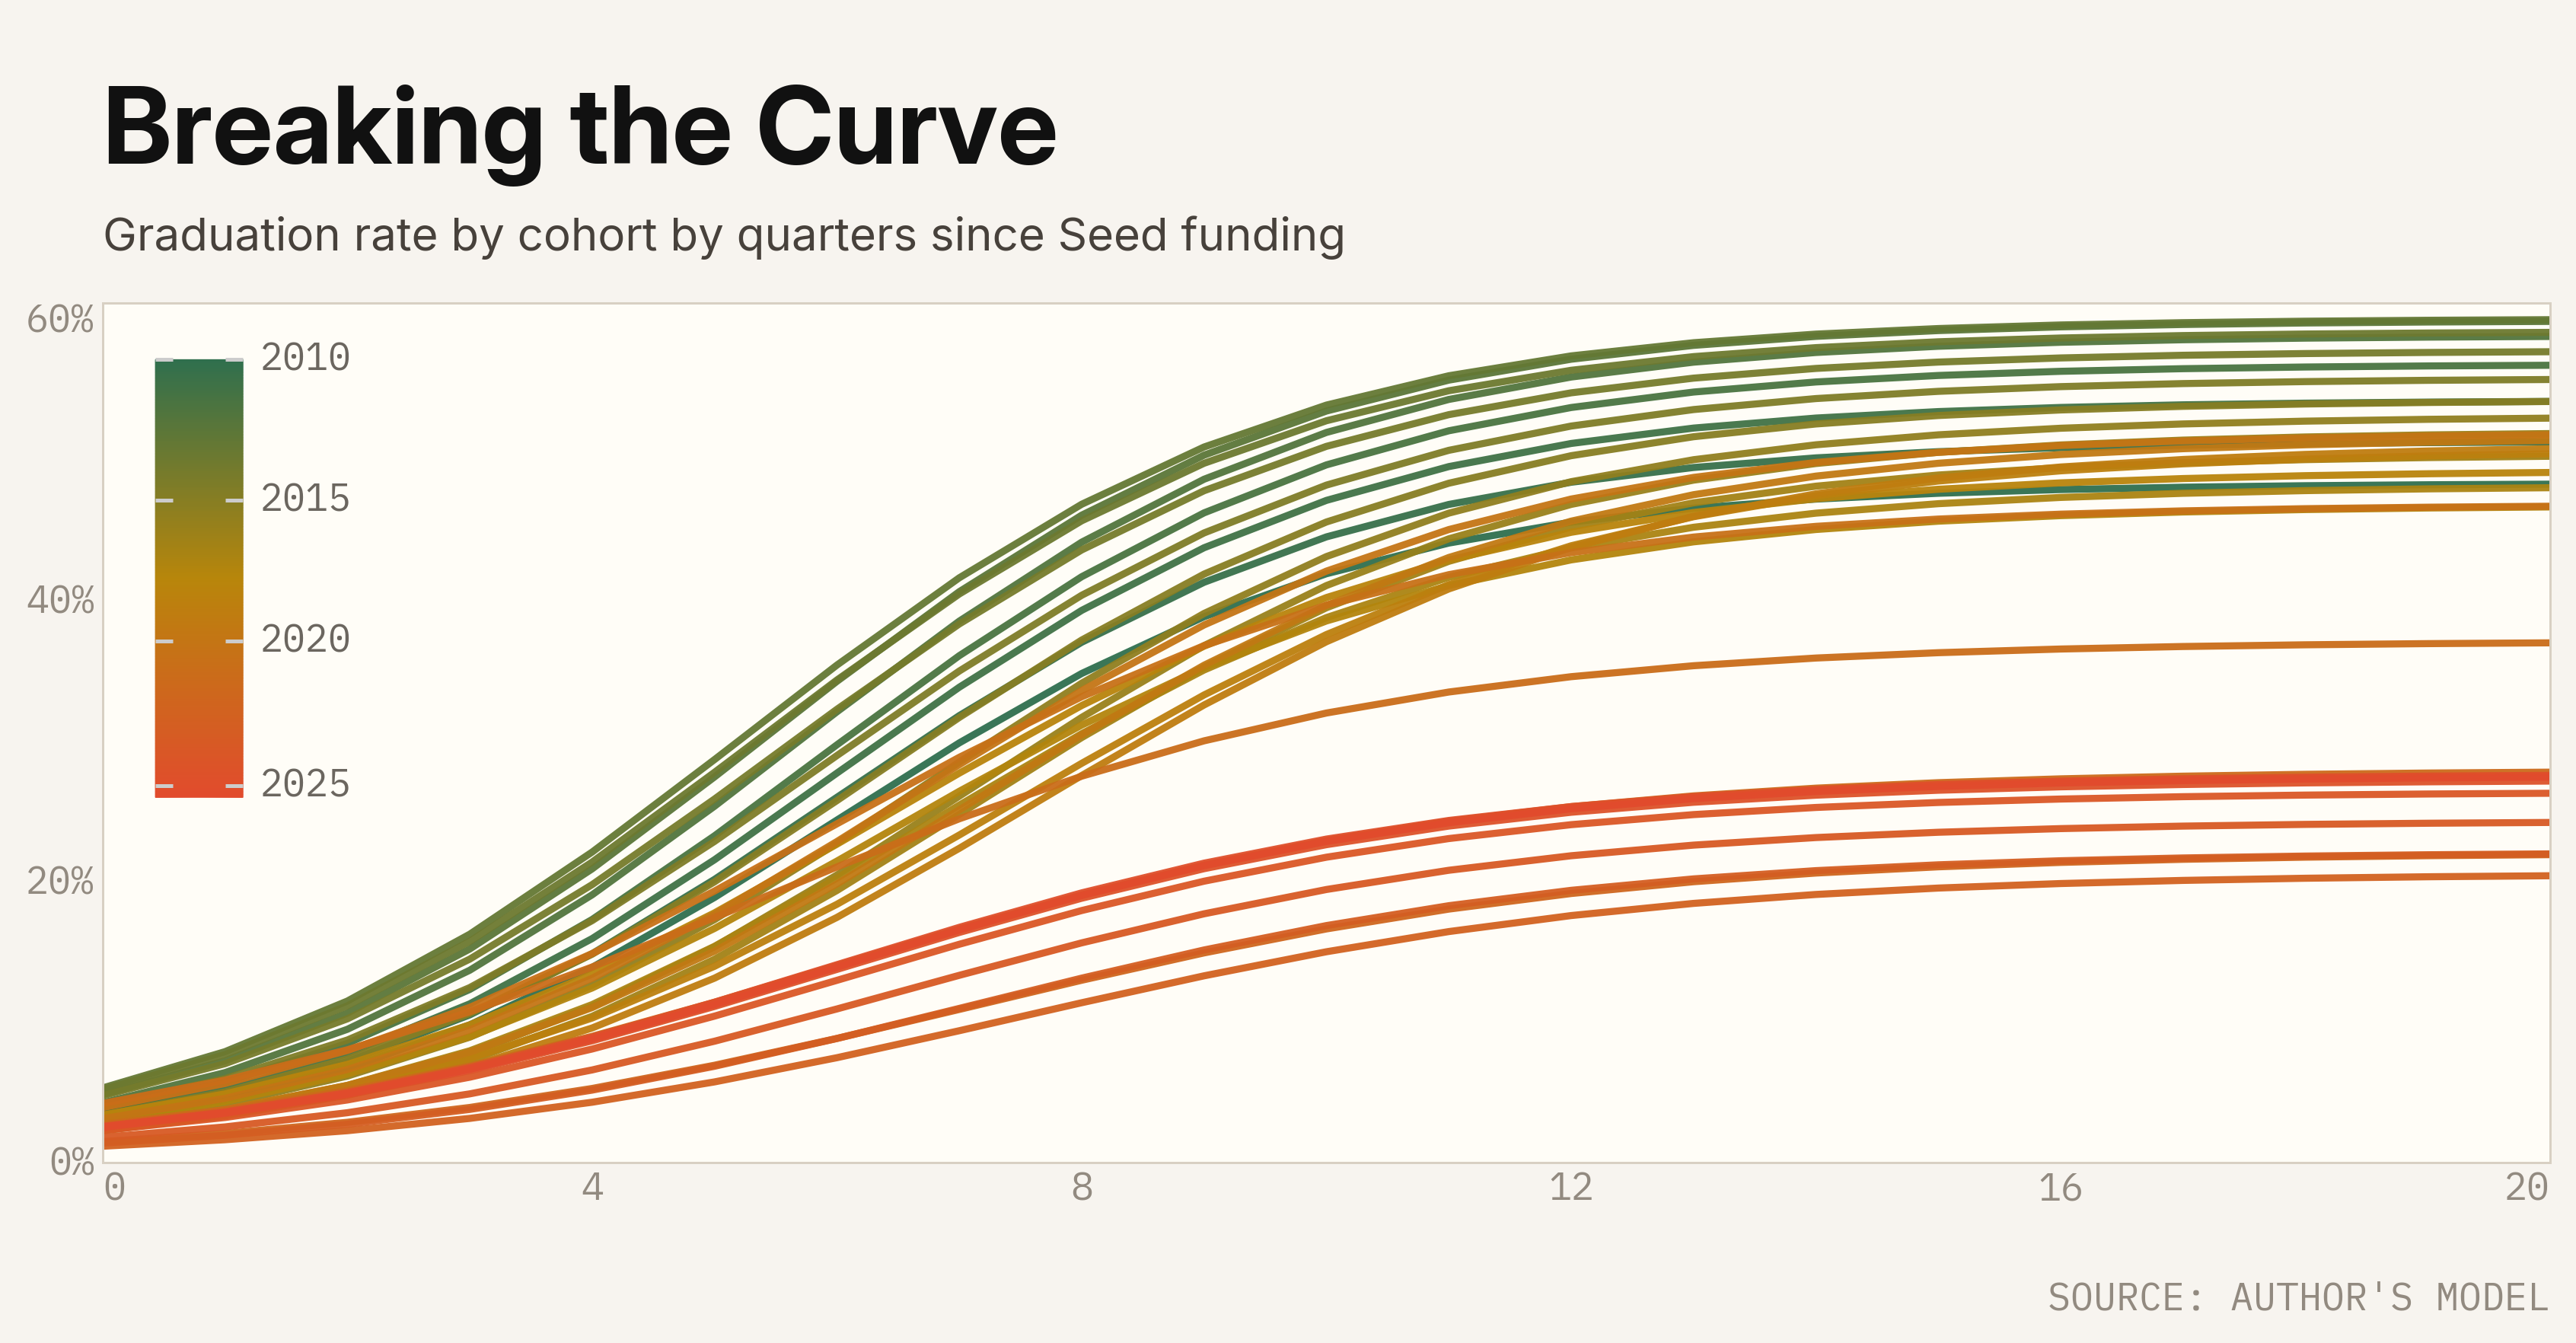
This helps visualize the dramatic collapse in graduation rates, with a very clear “before and after”. And it only took a quarter or two for the new reality to set in.
Inevitabilities: death and taxable M&A events
As I mentioned earlier, there’s no obvious source of data for the death or exits of Seed stage companies, so I need to make assumptions.
I assume any company that doesn’t graduate to Series A “exits” one way or another – either shutting down or getting acquired. The specific outcome doesn’t matter for the analysis.
I further assume that companies within each cohort graduate or exit on S-curves with matching shapes but different end points:
- For example, if 50% of the companies who will ever graduate have done so by quarter six, I assume half of the eventual exits (either acquisitions or shutdowns) have happened by that date too.
- This is of course not true – strong companies tend to raise capital sooner than weak companies quit. But I think it’s fine to fudge a bit here, and it gives me a nice way to use the data I do have to infer the data I don’t have.
This gives us the last piece we need. We now have all the flows in (new Seed deals) and out (graduations and exits). Assuming some reasonable starting point, we can estimate the active stock of Seed startups from past to present.
Stocks and flows
With all that out of the way, the last thing to do is also the simplest – just add up the “alive” companies (those that haven’t yet graduated or exited) across all cohorts at each point in time.
Stock-flow equation: Active Seed Stock = Prior Active Seed Stock + New Seed Deals − Graduations − Exits
Here’s what I got:
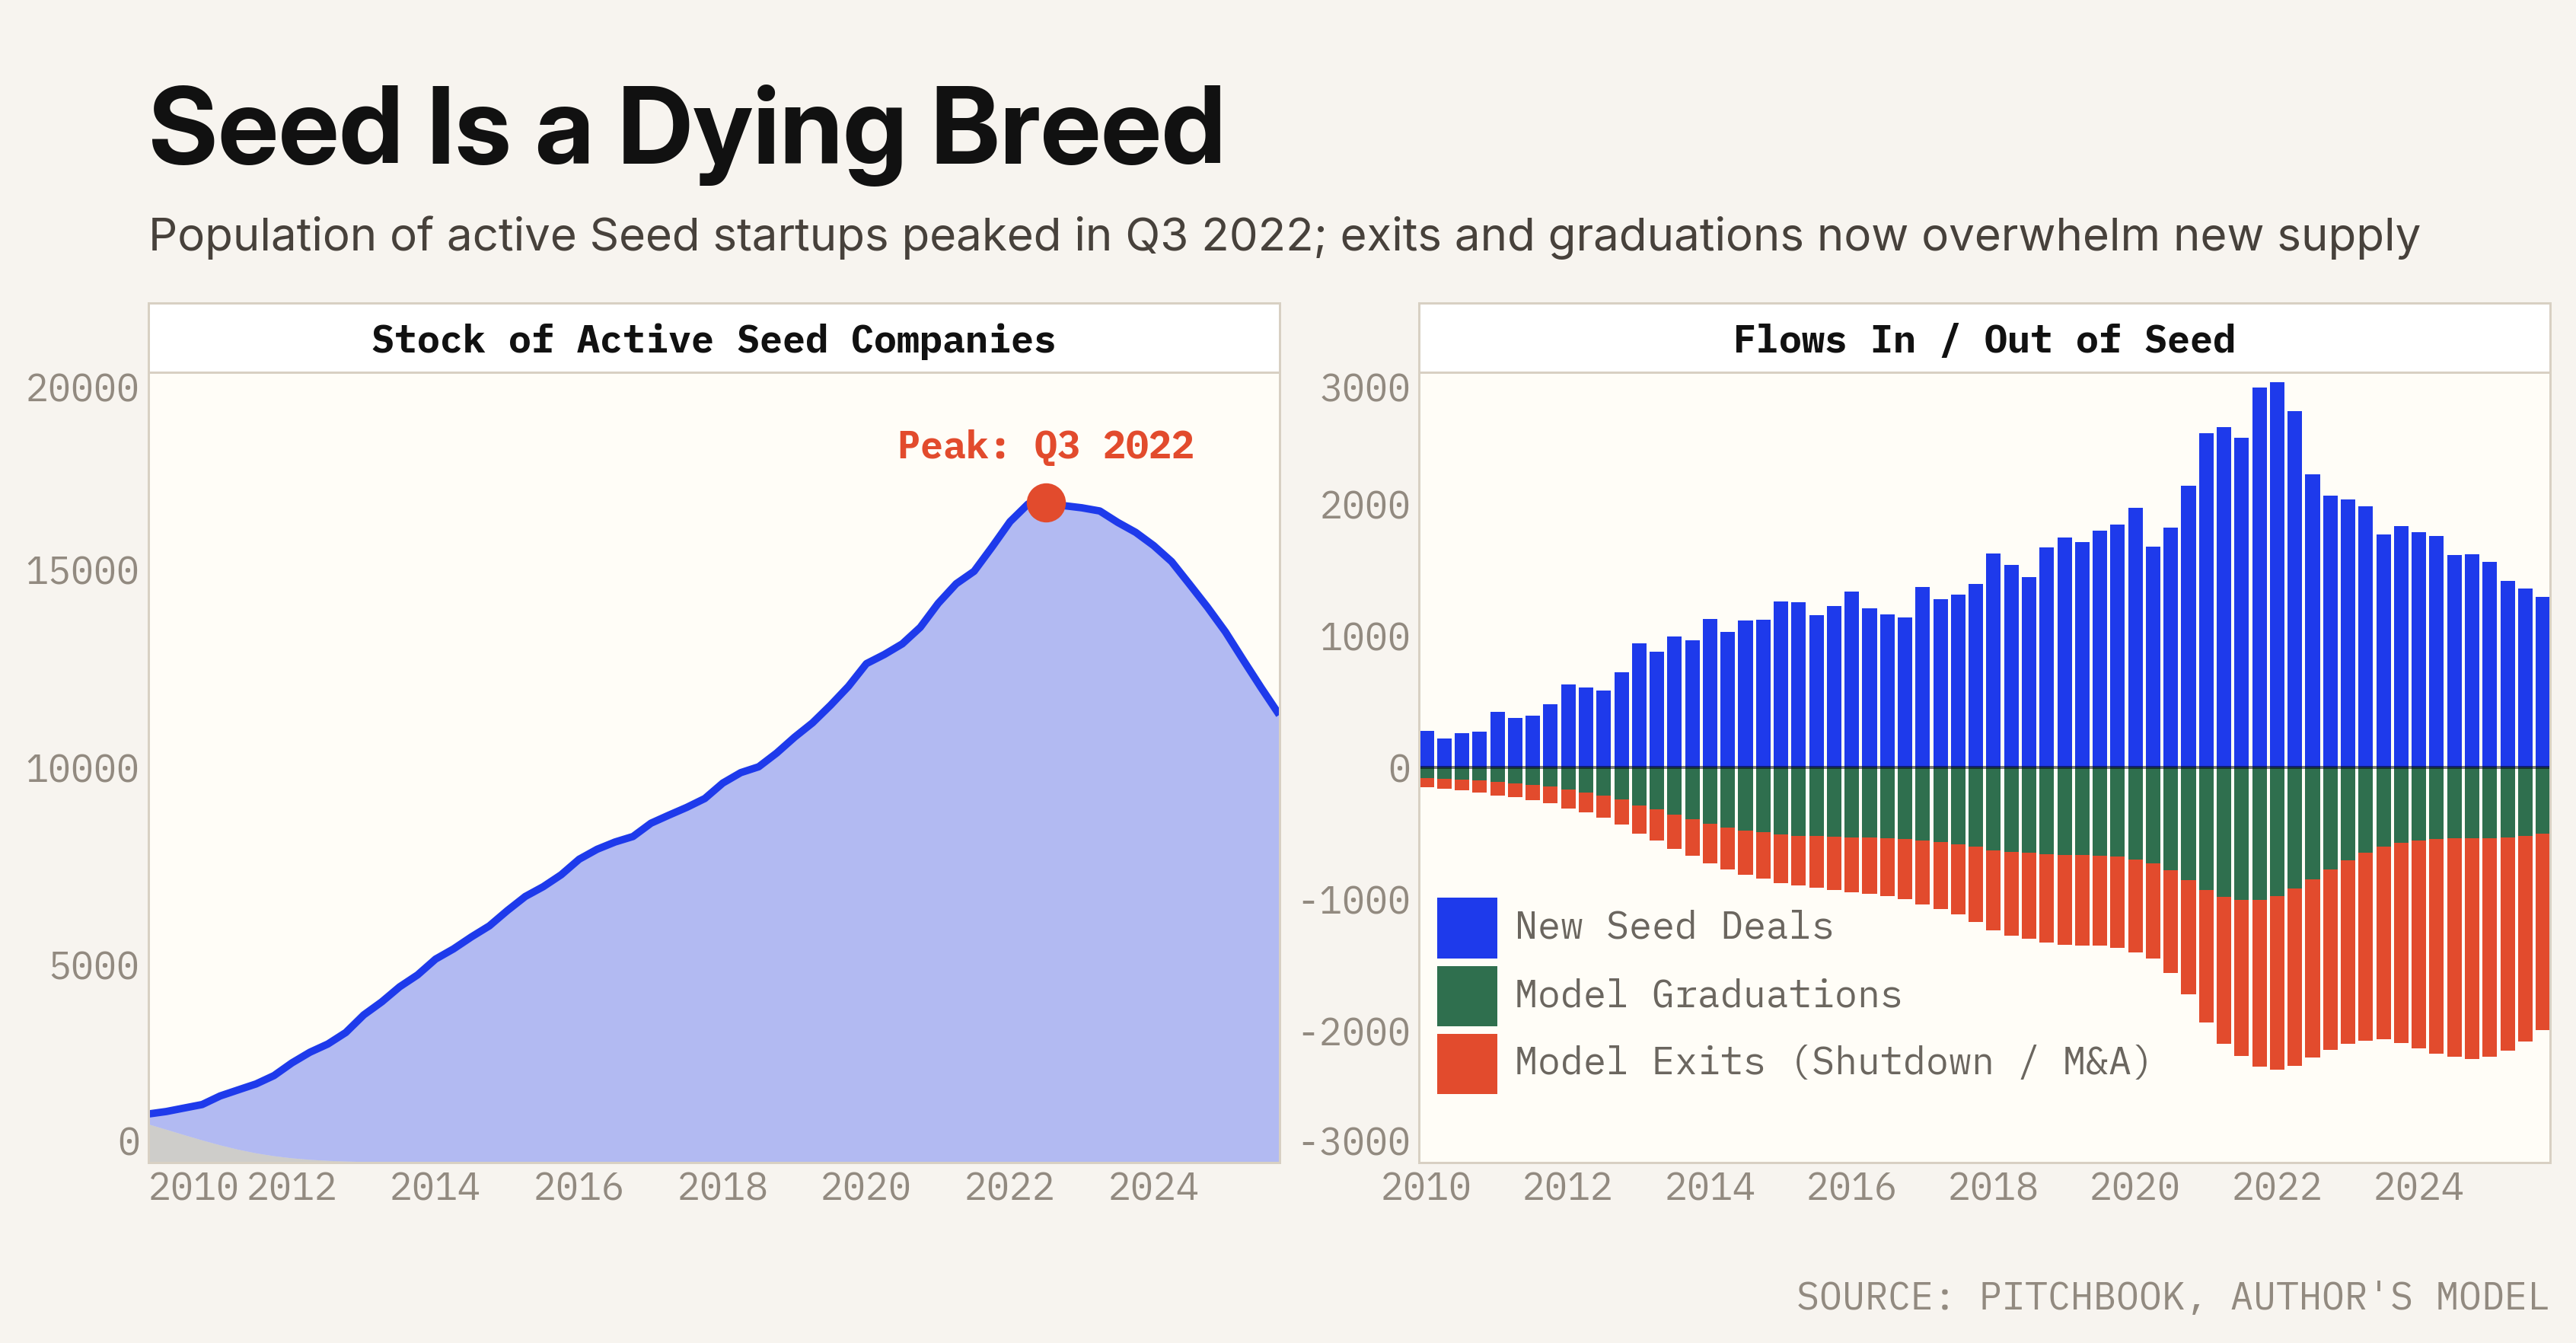
Seeds rose, they peaked, then they fell. The peak is roughly Q3 2022, and the live population has been in free-fall ever since.
What’s extra striking to me about this chart is that no one (to my knowledge) has ever bothered to construct it, despite how naturally it follows from the graduation data. Once you have the graduations and a plausible assumption about the timing of exits, this graph naturally falls out.
The data itself is striking too. Maybe I missed it, but I don’t see anyone talking about the apparent empirical fact that the total stock of Seed stage companies is falling. Despite all the crazy headlines about venture funding of AI startups, that torrent of activity is not enough to displace the lost activity from the post-2021 venture market reset.
Looking at rates (flows divided by the stock), the model estimates that in 2024 exits alone (i.e. excluding graduations) began to exceed new Seed financings. 13% of active seed startups are shutting down or being acquired (I’d assume most are shutting down) each quarter, while new financings are only adding about 11% to the pool:
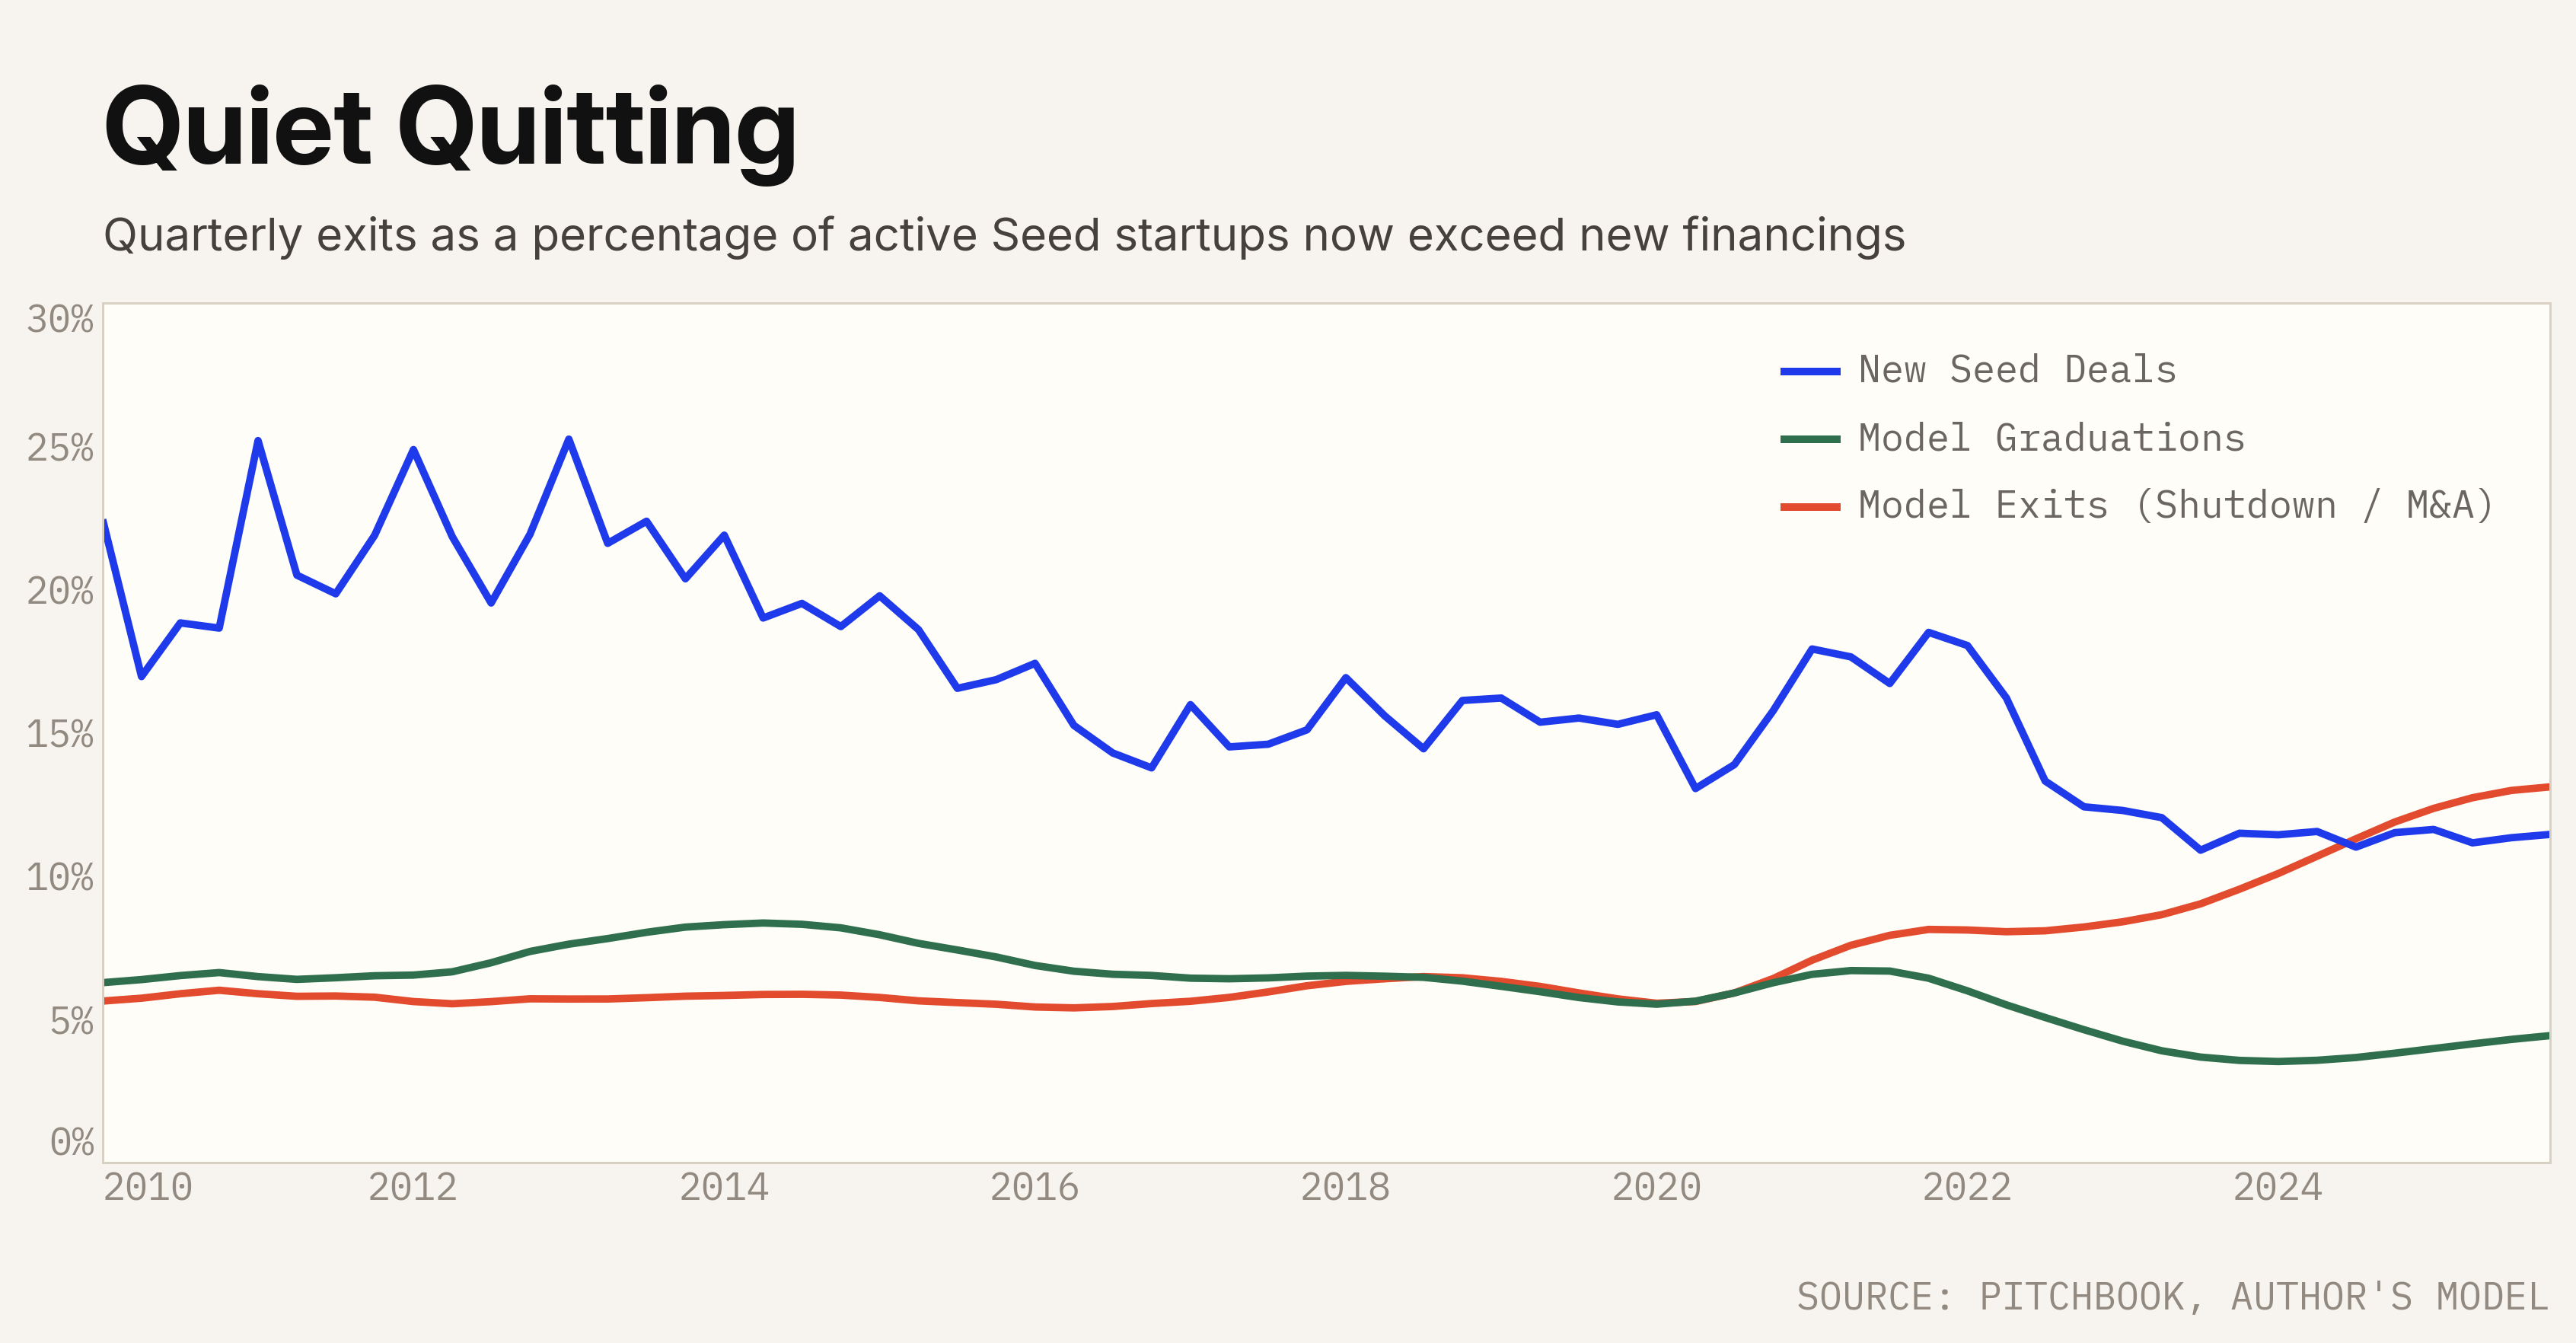
- The uptick in quarterly exits is notable, a doubling relative to the historical norm of ~6%
- Quarterly graduations have fallen somewhat, but seem to have bottomed out
Taking stock
This analysis challenges the representativeness of the headlines that grab attention in Silicon Valley:
- Yes – there’s a lot of activity right now in AI and there are many companies getting funded to attack that opportunity head-on.
- Meanwhile, there’s a whole set of pre-AI companies that got funded during the last boom that are “not going to make it”, and that process is still very much working its way through the system.
Despite all the present activity, the total number of Seed stage companies is in decline.
This is not surprising when you notice that every company that does get funded has something to do with AI.
- What happened to all the perfectly good, non-AI opportunities? It can’t be the case that the “true” opportunity set is 100% AI related.
- There must be a large set of opportunities that aren’t getting funded right now because investors are locked in on AI and still licking their wounds from all the non-AI, pre-AI companies they funded that didn’t or won’t work out.
Prior startup cohorts are flunking out, and the market is funding a narrower style of business today. This has driven the rate of startups exiting the gene pool above the rate of fresh blood entering the system.
This was not what I originally set out to find, but I’m glad to have stumbled upon it. This phenomenon is badly under-discussed.
Part two − the valuation misnomer that started me down this path − coming soon.