Who knew there was such skew?
Note: this analysis only includes public software companies that traded continuously from January 2020 to May 2022. Companies that went public or got acquired during that period are excluded.
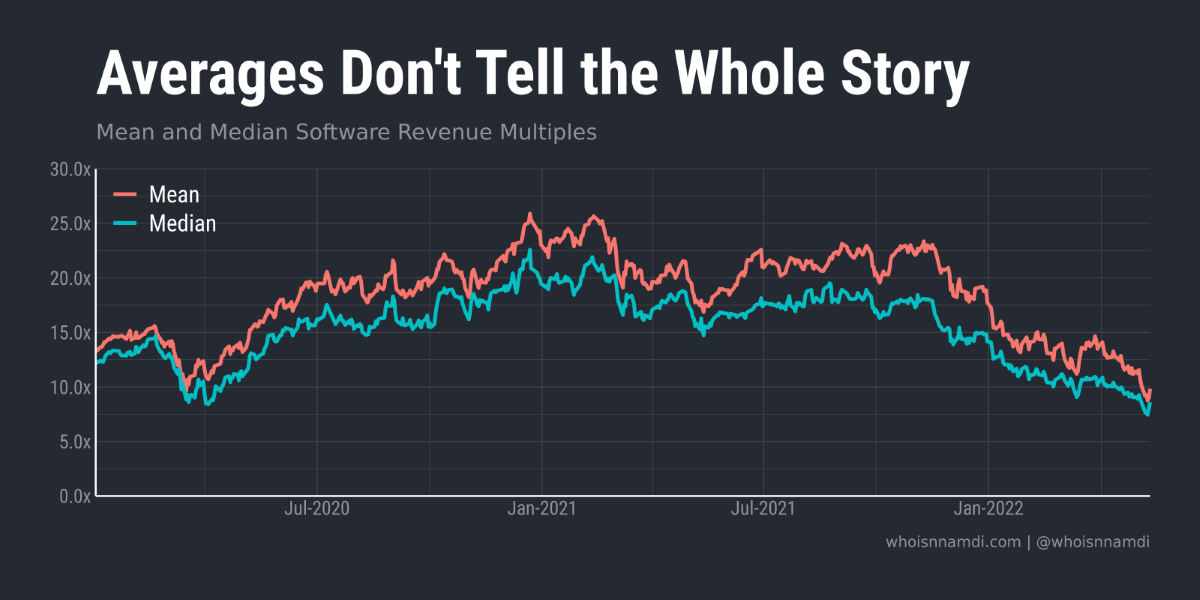
It's been said before, and it's worth repeating: averages don't tell the whole story.
You can begin to see why by plotting average revenue multiples against median multiples. They aren't the same.
In fact, the distance between them tends to fluctuate over time.
- In the lead up to COVID they were quite close
- Then, they grew apart
- Only recently, they've gravitated closer again
A single line at best summarizes the data and invariably misses important details.
Let's zoom in:
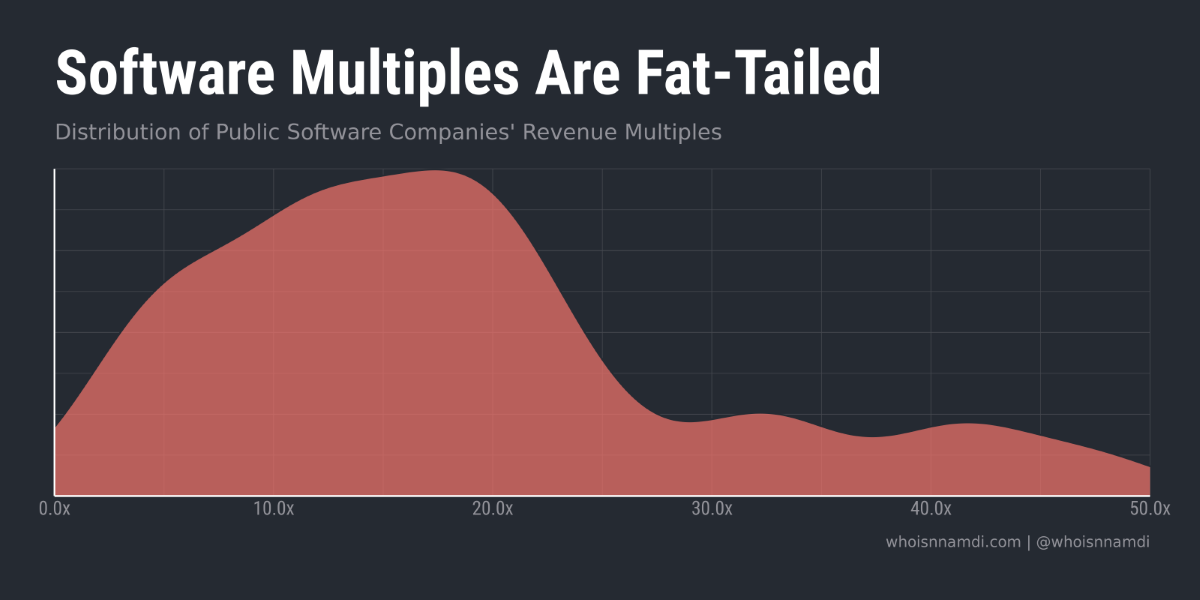
Like software monetization, software valuations are fat-tailed:
- Most companies have unremarkable valuation multiples
- A few, however, skew well to the right, creating a long tail of multiples
This tail skews the distribution of multiples and increases the variance between public software companies. I'd imagine the situation is even more extreme among private software companies.
That variance changes over time, rising and falling:
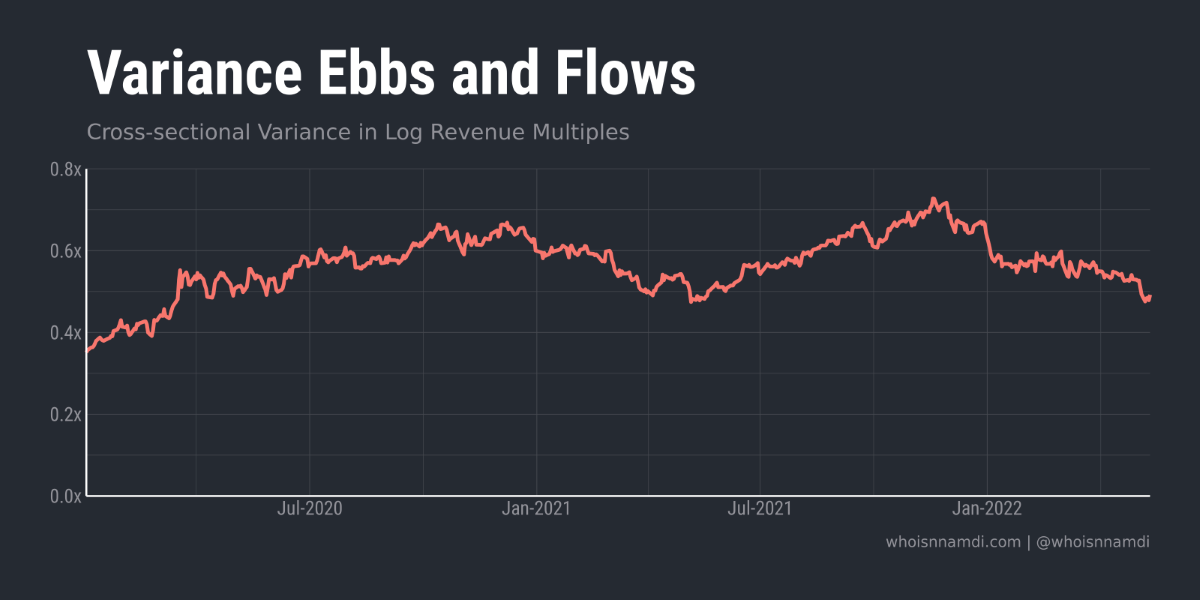
Note: for statistical reasons I won't explain here, the remainder of this essay will refer to log-transformed software multiples instead of their raw values.
I'd love to explain this dynamic.
It's at this point that any good software investor turns to ol' reliable: regressions of valuation multiples on revenue growth and profitability:
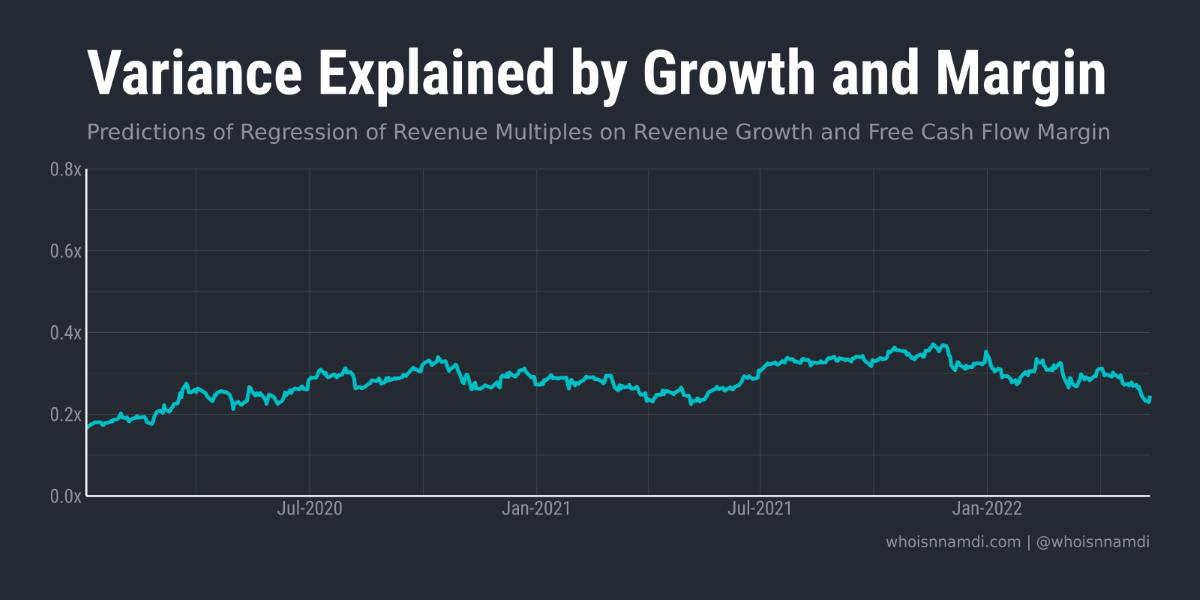
We see a similar, if subdued, pattern in the variance that can be explained by financial performance. But notice how much variance our standard regression leaves on the table, unexplained.
Growth and profitability do not perfectly predict valuations.
I call this unexplained variance, the "dark matter" of software valuations:
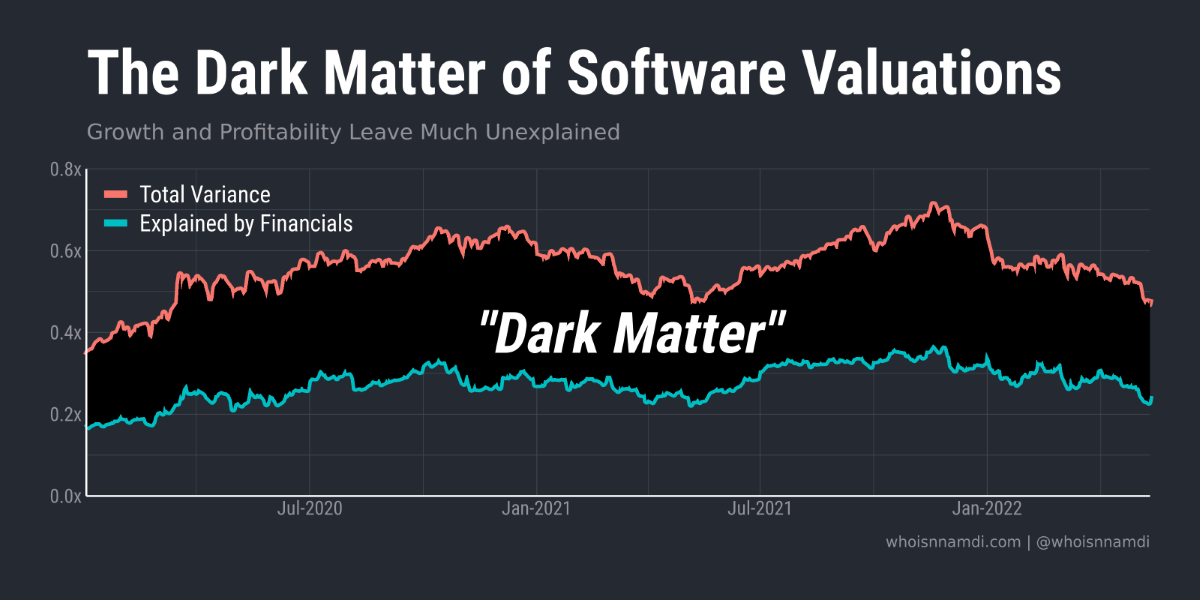
Growth and profitability never explain much more than half of the variation in multiples:
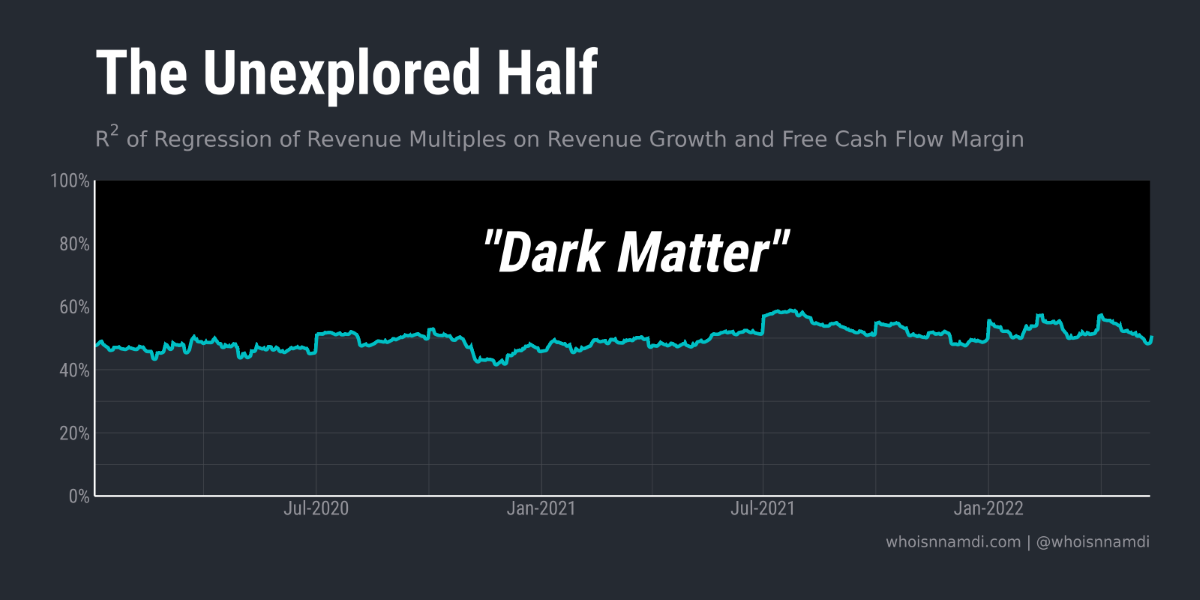
What's hiding down in the deep, dark depths of the software universe?
Let's grab our telescope and zoom in once again.
Stranger things (and valuations)
We know that growth and profitability are imperfect predictors of valuation.
Let's remove their effect and focus now on the remaining, residual, variance in valuations. This means that we'll focus on relative rather than absolute valuations – relative to what growth and margins would predict, that is.
Here's how it looks:
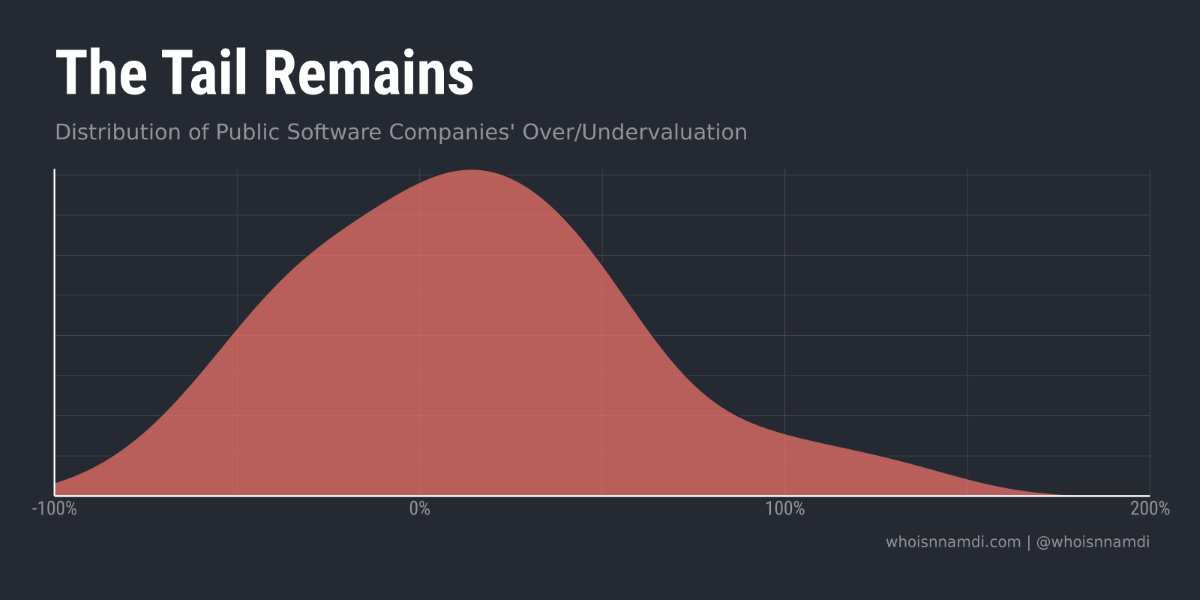
The fat tail is less severe but still persists, even after accounting for financial performance.
Many companies hover near zero, which is to say their valuations are perfectly predicted by growth and profitability, but a number are quite "overvalued" on the basis of their financials alone.
This gap between expectations and reality is quite persistent. Over/undervaluation does not meaningfully mean-revert, even over multiple years:
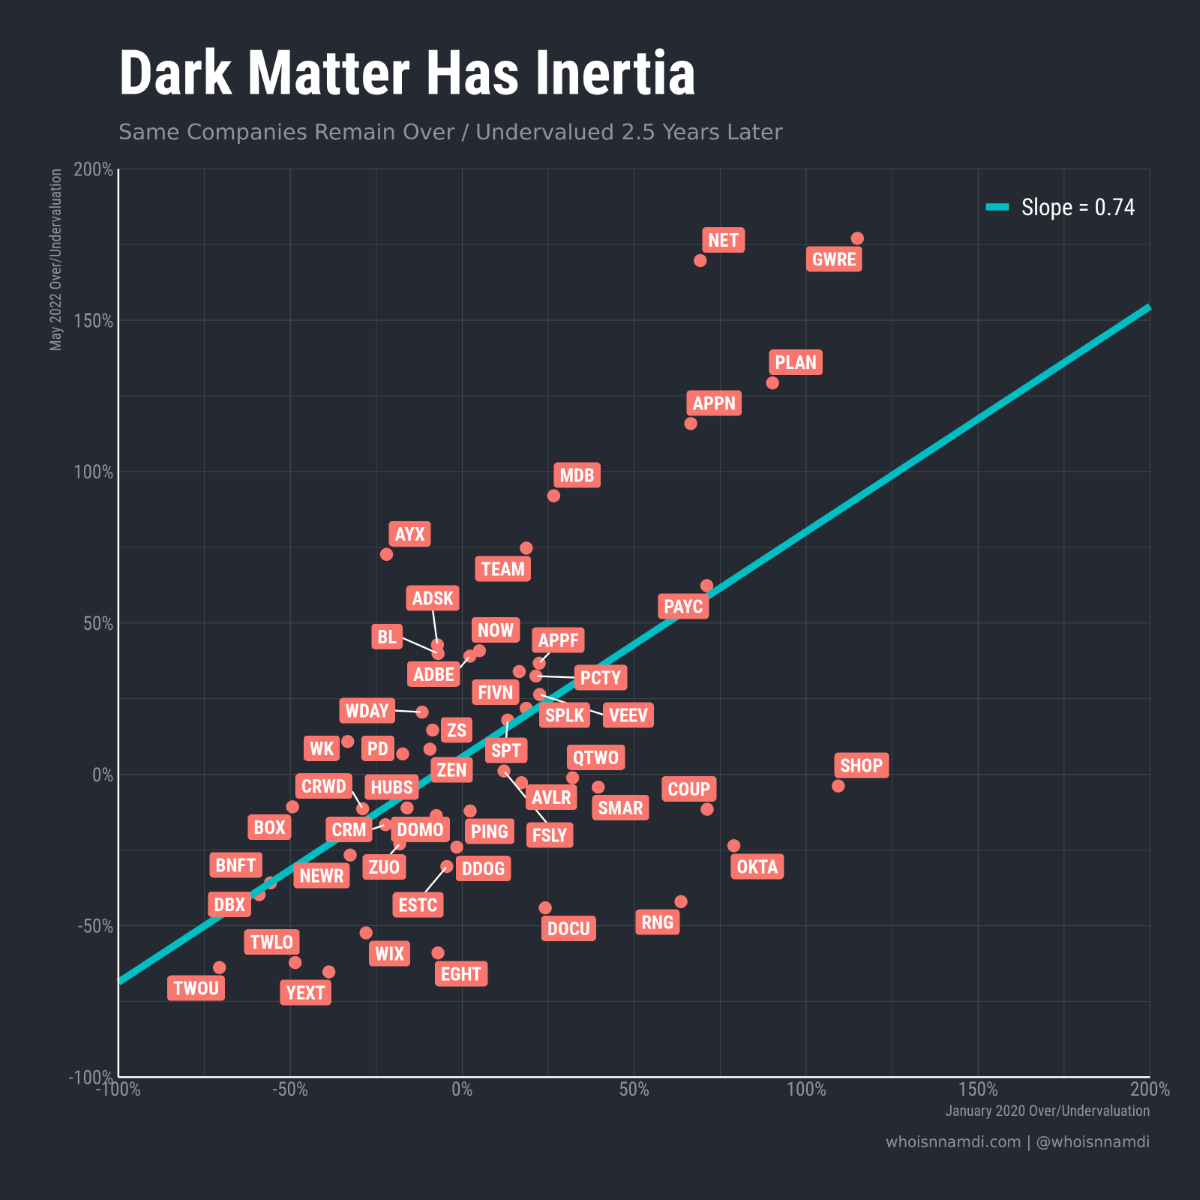
- A 50% overvalued company in January 2020 by May 2022 still traded ~40% above the valuation implied by its growth and profitability
- A 50% undervalued company continued to sag ~35% below its predicted valuation by the end of this period
Some did see major revisions:
- Shopify, Okta, Coupa, DocuSign, and RingCentral all fell back down to Earth after flying high for some time
- Cloudflare, Appian, Alteryx, MongoDB, Atlassian, Anaplan, and Guidewire all ended up much higher than where they were pre-COVID
In addition to individual companies, the overall distribution of unexplained "valuation inequality" held in place the past few years, with some fluctuations:
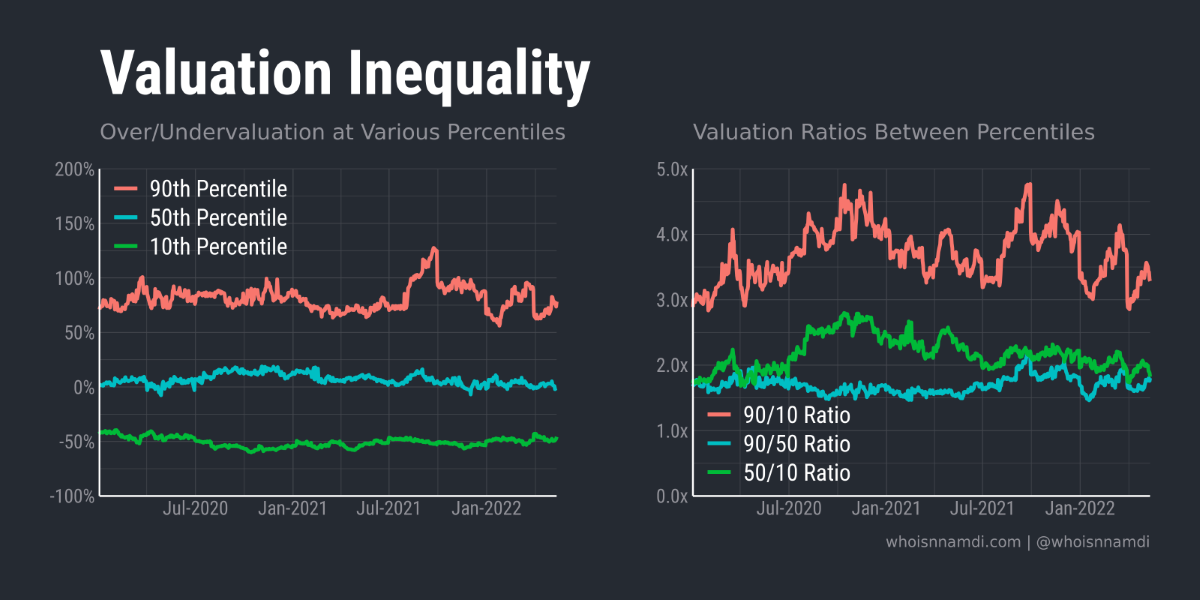
- Investors value the 90th percentile company ~75% more than you'd expected from its growth and profitability
- Meanwhile, they peg the 10th percentile company ~50% lower than you'd predict.
- In terms of ratios, 90th percentile software vendors are worth 3-5 times their 10th percentile peers.
Remember, we've already accounted for revenue growth and cash flow, yet we still see massive variability:
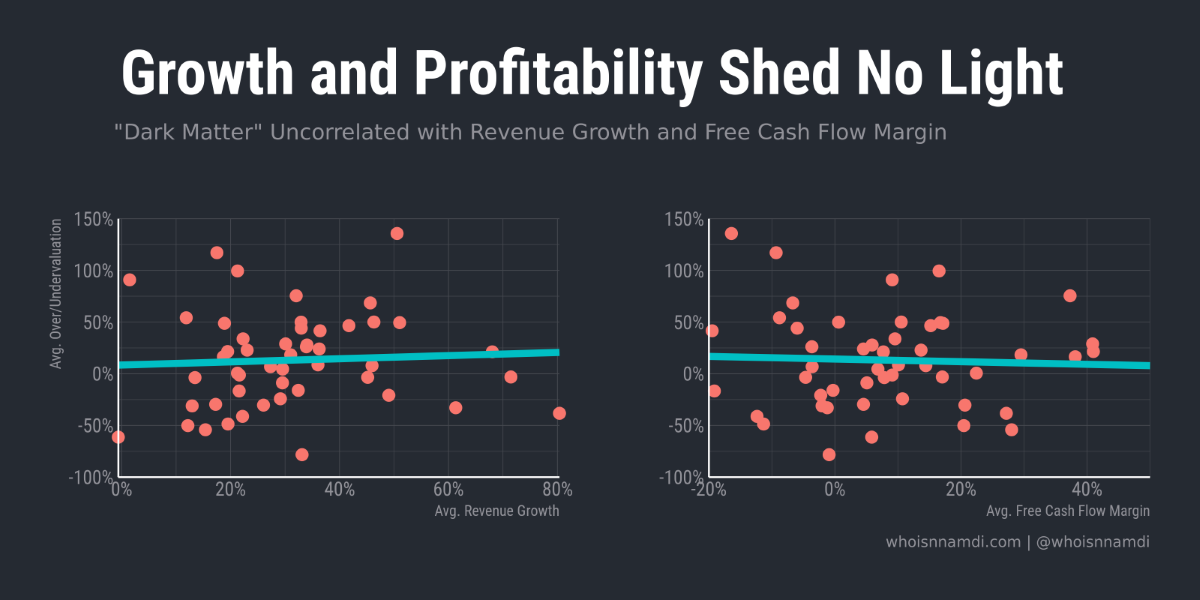
- On the revenue side, among companies growing ~50% annually we see valuation gaps as large as ~70% (i.e., same growth, yet one company is worth 70% more).
- It's even worse for software companies growing closer to 20% year-over-year, where the gaps are even bigger: the most valuable company is worth ~2.5 times the least valuable.
- On the free cash flow side, if we look at companies within +/- 10 percentage points of breakeven, we see companies worth five times as much as the least valuable
Needless to say, the variation in software valuations is extreme, and that's after factoring out what we'd already expect based on financial profiles.
Darkness into light
I hope I've driven the point home that growth and profitability aren't everything.
OK, but what is this dark matter stuff?
Clearly the most obvious metrics fail to account for a sizable share of the variation in valuations among software stocks. Some sort of unobserved or latent characteristics drive the remaining differences.
Principal Component Analysis (PCA) is a great way to identify such latent factors. It's a statistical technique for summarizing the key informational content contained within a larger data set.
A full explanation of PCA is beyond the scope of this essay. Just know that, like alchemy, PCA lets us put dark matter in and get some nuggets of gold out.
When I run PCA, here's what I find:
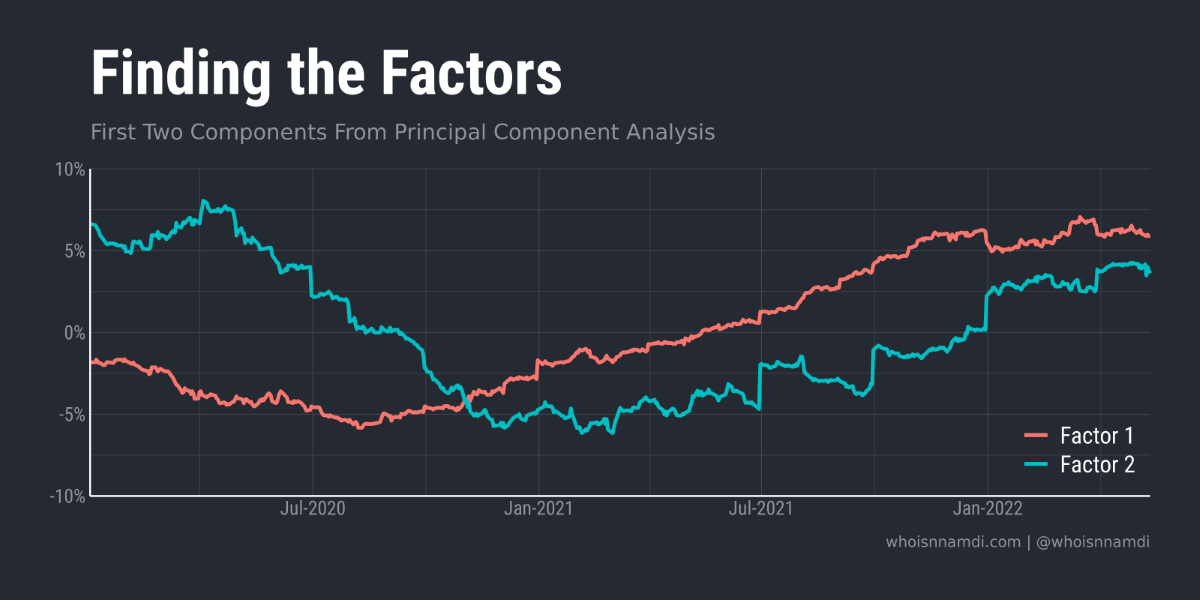
PCA spits out two latent "factors" that highly explain our up-till-now unexplained valuation puzzle.
Unfortunately, these factors don't come out of the box with much explanation. We must interpret them manually.
After staring at "Factor 1" for a while, it hit me – the line looks eerily similar to the path of the U.S. economy over that period!
Folks, we have a winner:
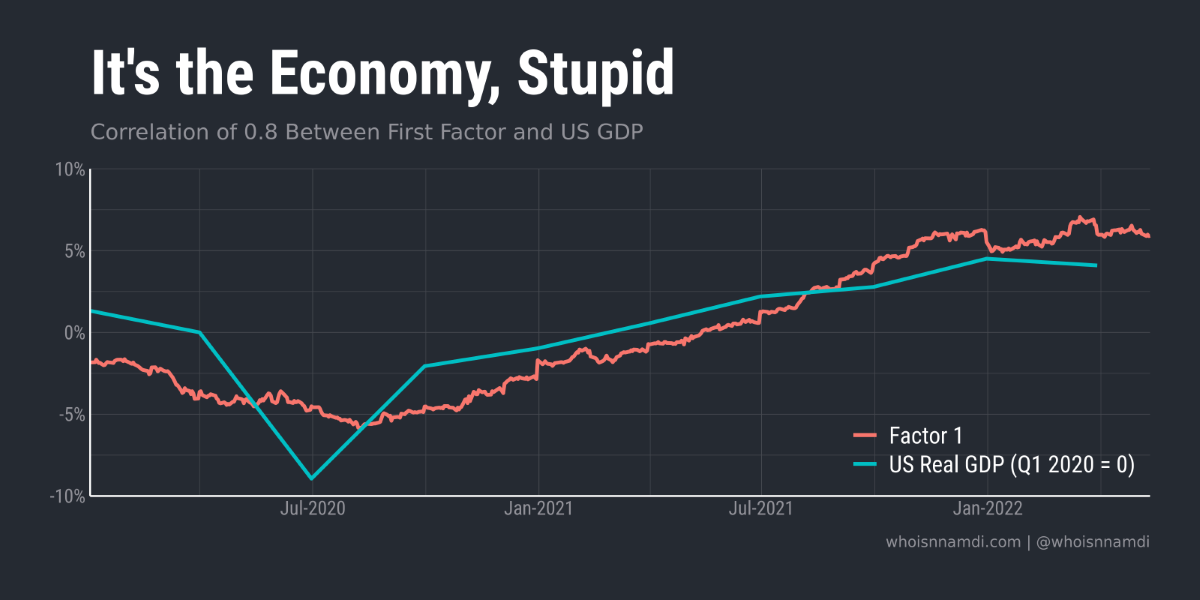
Beautiful.
Our first hidden factor is not a particularly mysterious one.
Despite some claims to the contrary, investors believe software companies are quite sensitive to the broader macroeconomic environment. In fact, it's the variable that correlates most highly with valuations after accounting for the individual financial performance of each company.
The latent factor tracks the COVID recovery quite well, in some ways even better than the official GDP statistic, which is only released quarterly – a significant delay.
The factor provides a daily, real-time estimate of economic performance, at least that portion which is relevant for software companies (also called nowcasting).
I had less success figuring out the second factor. If you have any ideas, please send them my way!
With PCA, it's customary to plot the data against the first two factors, with the X and Y axes representing each company's correlation with the factor:
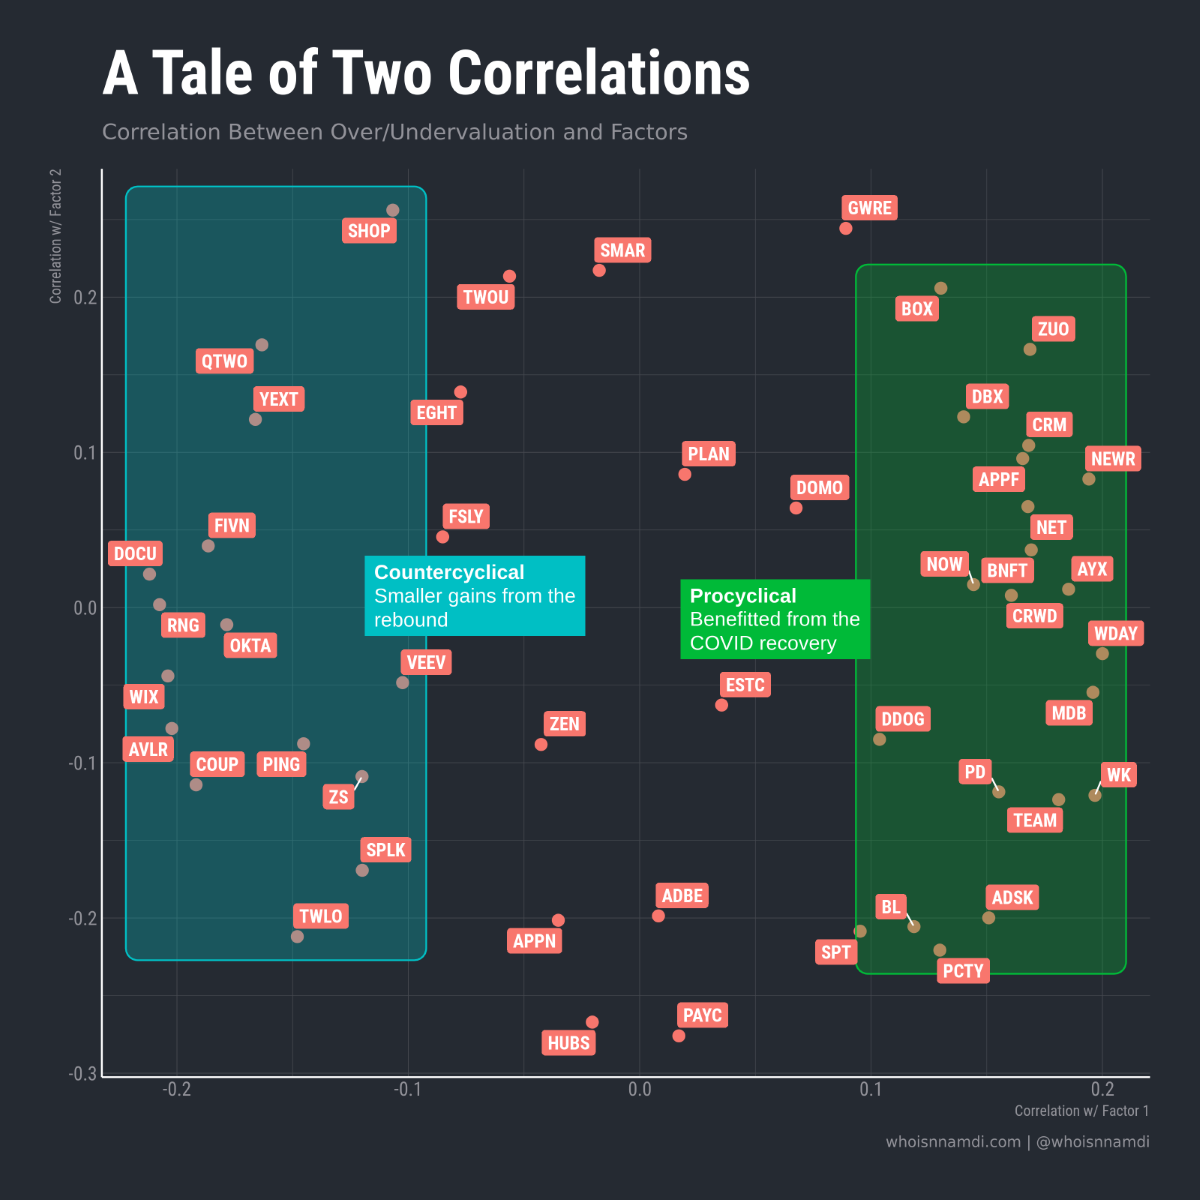
- Companies on the right side correlative positively with the GDP factor, suggesting they've benefitted disproportionately from the COVID bounce-back
- Conversely, stocks hovering to the left had less to gain from the rebound
I could spend (and may have already spent) hours staring at this plot. Rather than continuing to play "Where's Waldo," here are a few clusters I noticed (Q: What did I miss?):
- Financial engineering: Developer-centric tooling and infrastructure like Datadog, Elastic, MongoDB, Atlassian, PagerDuty
- Easy storage, easy life: Storage companies Dropbox and Box
- Trust, but verify: Zero-trust and identity solutions like Okta, Ping Identity, Zscaler
- Call me maybe: Cloud-based contact center and communications companies Five9, RingCentral, 8x8
A step in the right direction
Now let's come full circle and incorporate the GDP factor into our previous regression while also allowing each stock to have different sensitivity to the factor.
Here's what we get:
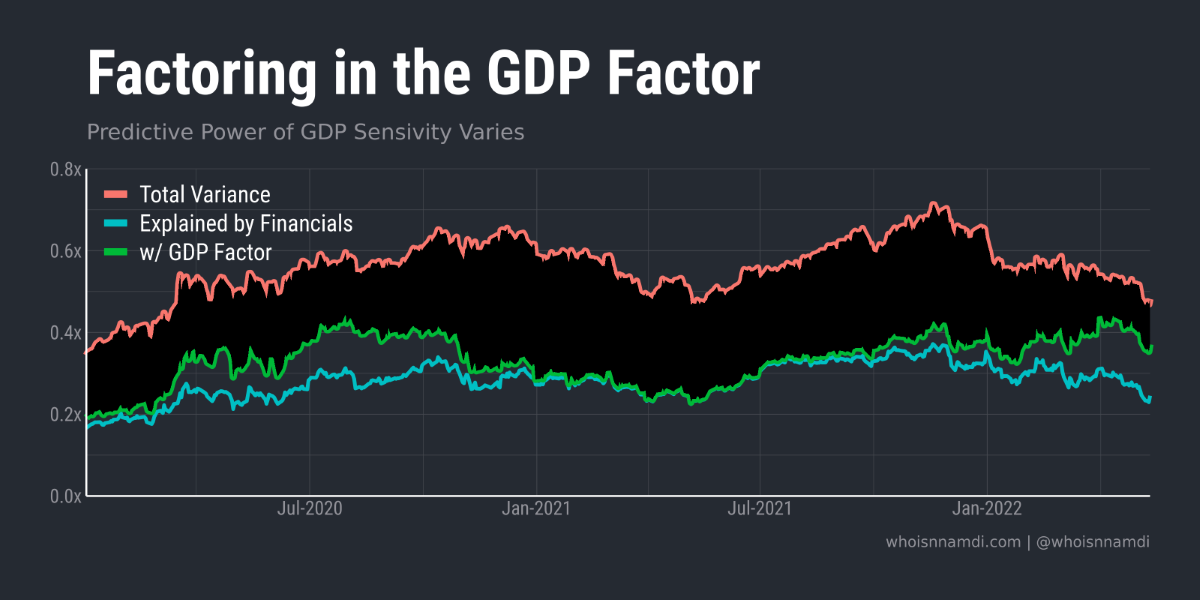
The GDP factor helps explain some of the mysterious "dark matter" but not always the same amount:
- In the weeks before COVID turned everything upside-down, the GDP factor didn't explain much variation in valuations
- Then, as the pandemic began, the GDP factor rose in importance, granting significant predictive power
- As the first positive results of the mRNA vaccines come out, it recedes again, and for about three quarters the GDP factor doesn't explain much over and above individual financial performance
- Finally, as the COVID recovery finally stalls out, the GDP factor rises in importance again
Here's how it looks in R-squared terms:
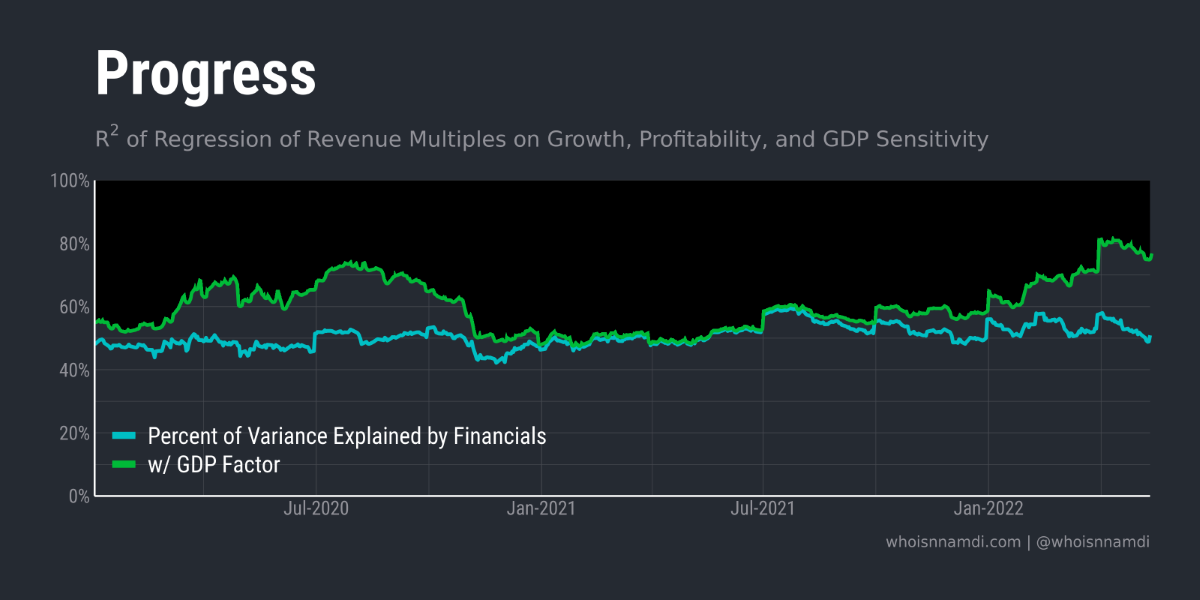
Still a lot of dark matter out there, but we've made great progress:
- At it's highest, the combination of (1) individual financial performance and (2) sensitivity to economic conditions explains ~80% of the cross-sectional variance in software valuations
- That said, there remain times when it explains no more than 50% of valuation variance
I'm fascinated by these dynamics, especially the middle period where, for whatever reason, economic sensitivity temporarily stopped mattering for how software companies were being valued, at least relative to one another.
Conclusion
So we've managed to chip away at some of the dark matter hiding among software valuations.
It's often said that the long-term growth trajectory of cloud companies is relatively secular, which is to say it's independent of general economic fluctuations.
It turns out software companies *are* sensitive to broader economic conditions in the short-run, at least in eyes of public investors.
The relevance of this sensitivity rises and falls over time:
- In periods of economic uncertainty (e.g. early pandemic, Q2 2022, etc), the GDP factor begins to matter quite a bit. Public investors care who gains and loses from a weakening economy.
- Meanwhile, when times are good, investors throw caution to the wind and ignore the economic sensitivity of software companies.
More sophisticated factor modeling could yield even more insights. No one pays me to do that though, so I think I'll move on.
If you do have thoughts on that second mystery factor, shoot me a note!
