In enterprise software, the "average" customer is a meaningless concept.
Paying too much attention to the "average" customer leads many founders and investors astray.
Instead, focus on the tails.
Here's why.

In enterprise software, the "average" customer is a meaningless concept.
Paying too much attention to the "average" customer leads many founders and investors astray.
Instead, focus on the tails.
Here's why.
Long-form essays on the economics of tech, with the data to back it up. All signal, no noise.
Read by 5,000+ founders, engineers, and investors.
Define "monetization" as the average revenue a software vendor extracts from its customers:
Wild variation in monetization across customers means most enterprise software customers contribute little to overall revenue.
For example, a late-stage software company with 50M+ in ARR and ~2,000 customers might have a small number of customers with enormous contracts, possibly greater than 500K or even 1M in ARR each, and a large number with tiny contracts in the ~10K range.
The extreme, non-negative variation around the average produces a right or positively skewed monetization distribution:
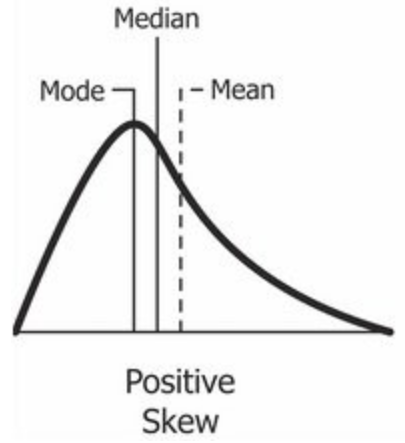
Sufficiently skewed distributions are "fat-tailed." Large customer contracts will determine the properties of the distribution, like its mean or variance. Similarly, large customers will account for an enormous proportion of overall revenue. In other words, software monetization is a power law.
In a previous essay, I introduced the notion of
Evidence for skewed monetization is tough to come by without access to a company's commercial contracts. However, we can infer the fat-tailedness from the SEC filings of public software companies with a simple trick.
The trick? A formula exists that calculates the concentration in the top percentiles of a power law distribution based on the
where
Plug in the
Invert the formula to yield the
This means we can infer
We can estimate the shape of the customer distribution by plugging
 Source: David Salazar
An
Before we proceed, know that this method only works if we assume upfront that the distribution is in fact power law distributed, at least in the tails. We never proved this, so don't interpolate/extrapolate too far with this method.
With that caveat acknowledged, let's throw caution to the wind!
Public companies do their best to hide customer concentration. But at a certain point fiduciary duty requires that they disclose revenue concentration, especially if a few customers account for a large enough chunk of revenue.
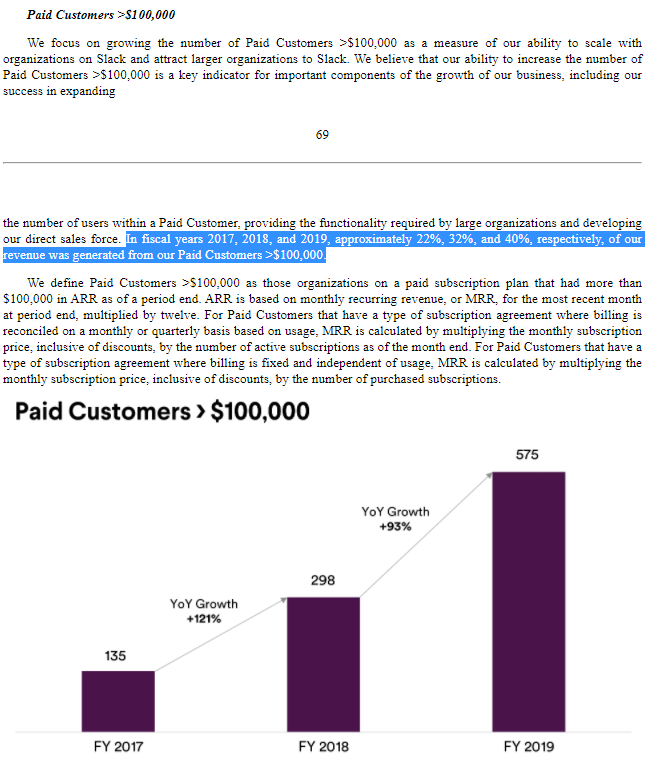
Commonly, companies will state that "no customer represents more than X% of revenue." Less frequently, companies will go further, disclosing the number of customers that exceed some revenue threshold, typically 100,000, and the proportion of revenue they represent. This gets framed as a point of strength — "look how many large customers we have" — but it also indicates customer concentration since the X customers with greater than 100K contracts are by definition the X largest customers.
Here's an example from Slack's S-1:
 Source: Slack's S-1
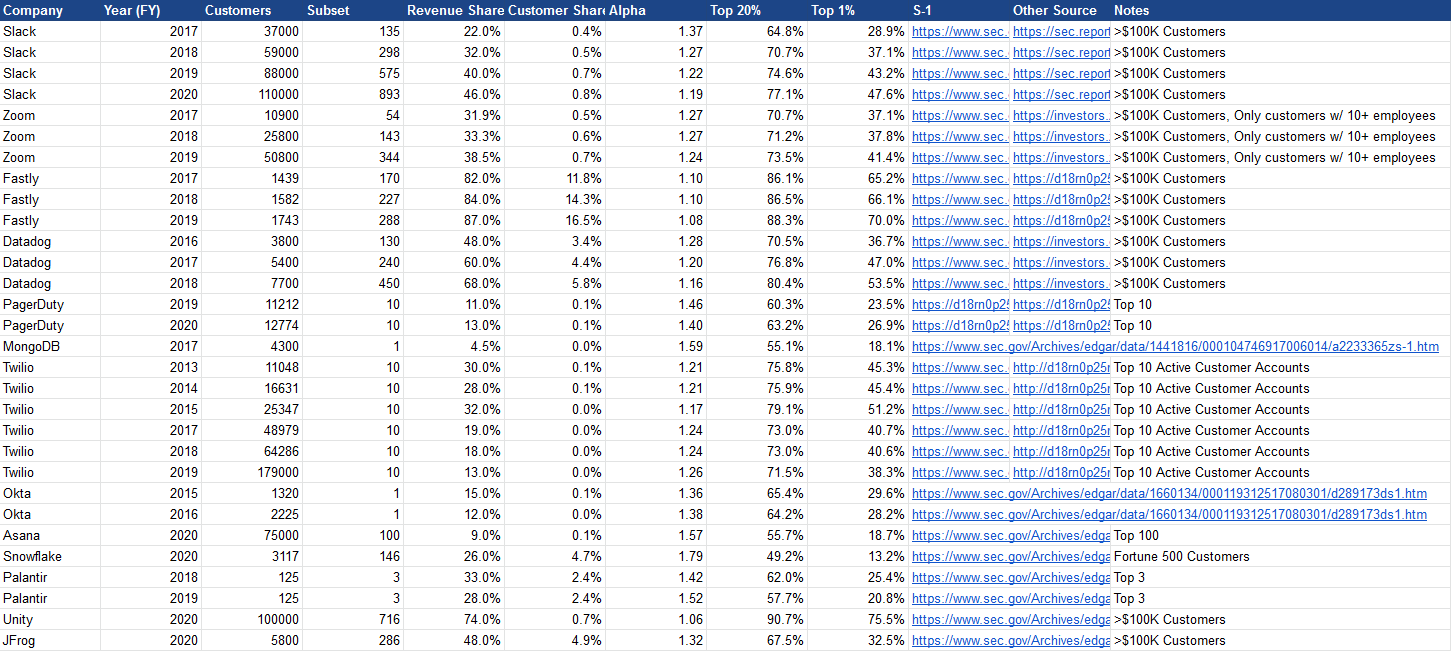
From this sort of disclosure we can calculate the
 Source
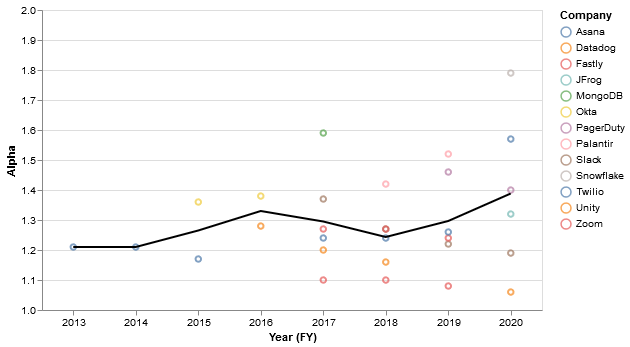
The alphas are universally below 2, implying a high level of skew.
A more visual representation of the alphas (with the average in black):
The implied top-20% and top-1% revenue concentration are quite large for most companies (blue = top 20%, red = top 1%):
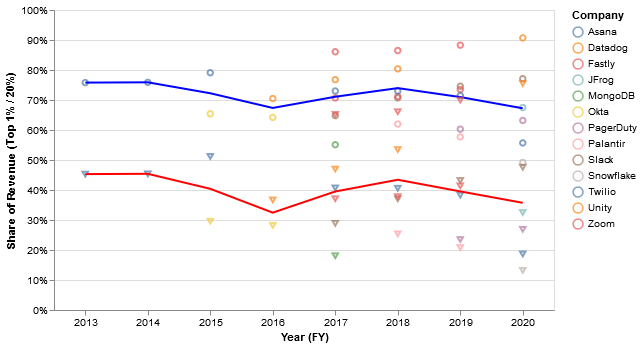
So, the top 20% typically represent ~70% of revenue, while the top 1% represent ~40%. Not quite Pareto 80/20, but pretty close! Interestingly, many companies tied to infrastructure in some way like Datadog, Fastly, and Twilio do have 80/20 monetization distributions, at least in some years.
As I caveated, these figures will be off to some degree. I'd guess they overestimate revenue concentration somewhat.
However, I'm comforted by corroboration from a report by Theta Equity Partners that uses a completely different methodology to estimate the monetization distribution of Slack's customer base. Based on the S-1 filing, they found that Slack's top 1% of customers account for 40% of total revenue in 2019:
As we mentioned previously, the data and the model imply a high level of variability in the “goodness” of Slack’s customers – a small (<1%) segment of “heavy” customers accounts for 40% of company’s revenues and generates revenue per customer which is more than 100 times larger than everyone else.
Using my methodology, I find that the top 1% of Slack's customers in 2019 represented 43% of revenue, which is quite similar.
It's easy to see these results and think "Yes, sure, customer concentration is a thing. So what?" But the implications of a fat-tailed monetization distribution are profound.
First, as I discussed previously in Why Don't VCs Index Invest, when facing a sufficiently fat-tailed distribution of returns, it doesn't make sense to be picky or overly concentrated in one's investments. Index investing is the optimal allocation strategy.
Here, returns are synonymous with revenue and investment is synonymous with customer acquisition costs, or CAC. If the distribution of revenue is fat-tailed, vendors should be trying to insert their software into as many customers as possible, as cheaply as possible. Don't try to land large upfront, as this requires investing in a heavy and expensive enterprise sales motion that may not yield results. Instead, spend small and land small, with each customer contract acting as a potential "lottery ticket" that may unlock a much larger contract later on, similar to an early-stage startup investment.
There's some merit to this analogy between venture capital and software go-to-market strategies. One only has to look at estimates of
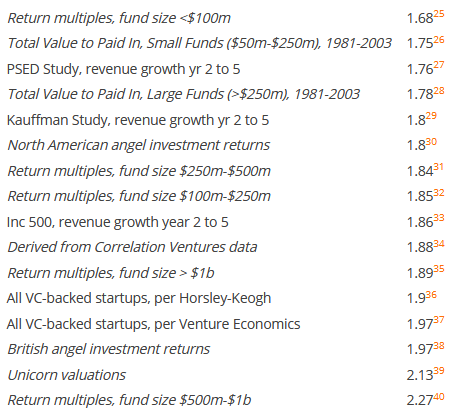 Source: Reaction Wheel
Second, as I allude to in the aforementioned essay, finite samples of a positively skewed, fat-tailed distribution tend to underestimate the average, or mean, of the distribution. Large values are rare, so small samples will tend to miss them. Unless you have an extremely large dataset, the "true" mean is typically larger than the mean you measure from the data. So the calculated sample mean tends to increase as the sample size grows, reflecting those large, infrequent outcomes.
Said more precisely:
An additional difficulty in the numerical estimation of moments—and, therefore, of risk—is due to the very slow convergence of estimated values to the exact values of the process, even if the associated moments are finite. This “slow Law of Large Numbers” is caused by the large weight of rare events (black swans), which take a lot of data to show up, and prevent a proper estimation of the moments of such processes through the moments of a sample. — Fat tails and black swans: Exact results for multiplicative processes with resets
Further, the largest value you are likely to see in a sample of power law distribution (the expected value of the maximum value) is proportional to the sample size
In plain English — your personal best can only get better with more attempts. In the realm of venture, that looks like this:
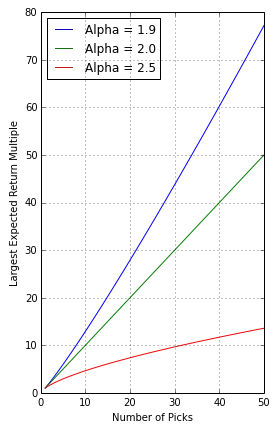 Source: Reaction Wheel
This is why returns in venture capital tend to increase with portfolio size:
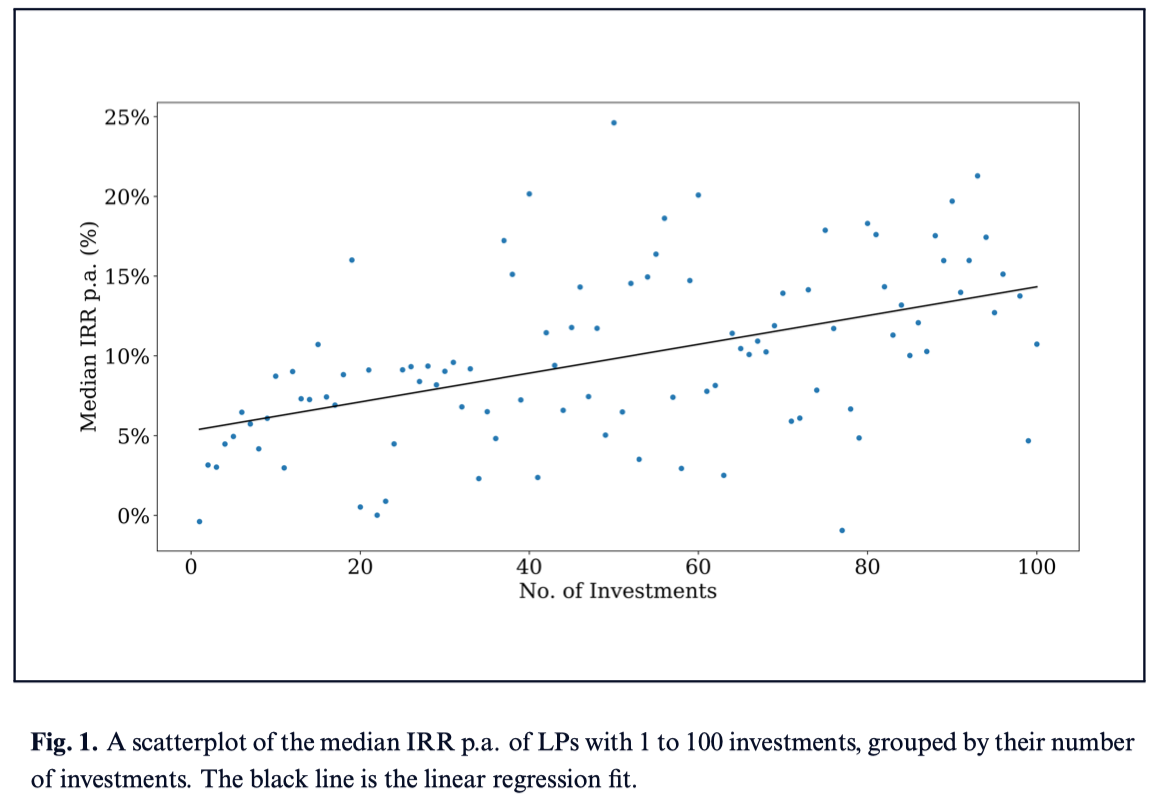 Source: AngelList
In the context of software monetization, the "true distribution" is the set of all potential customers while the "sample" is the set of current customers. Each customer is like a draw from a random variable representing all potential customers, just like a venture capital investment is like a random draw from a fat-tailed distribution of potential returns.
My claim is that the average monetization across your customer base — ARR/customer, revenue/customer, etc. — is an underestimate of the "true" or "potential" monetization. As you land more customers, so the logic goes, the revenue you extract will tend to rise due to this fat-tailed phenomenon, with no change in pricing model or customer targeting.
More is more, or specifically, more customers is more monetization, for the same reason that larger venture portfolios yield higher returns. Your wins get bigger the more broadly you penetrate the market.
It's natural to ask — "how much does current monetization underestimate potential monetization?"
Nassim Taleb has already done the math for us. Imagine that true average monetization is the sum of the monetization of customers smaller than the largest customer we've acquired thus far, which he calls
In the chart below, the shaded region represents larger customers yet to be acquired:
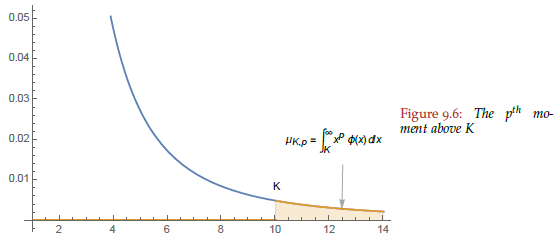 Source: Statistical Consequences of Fat Tails
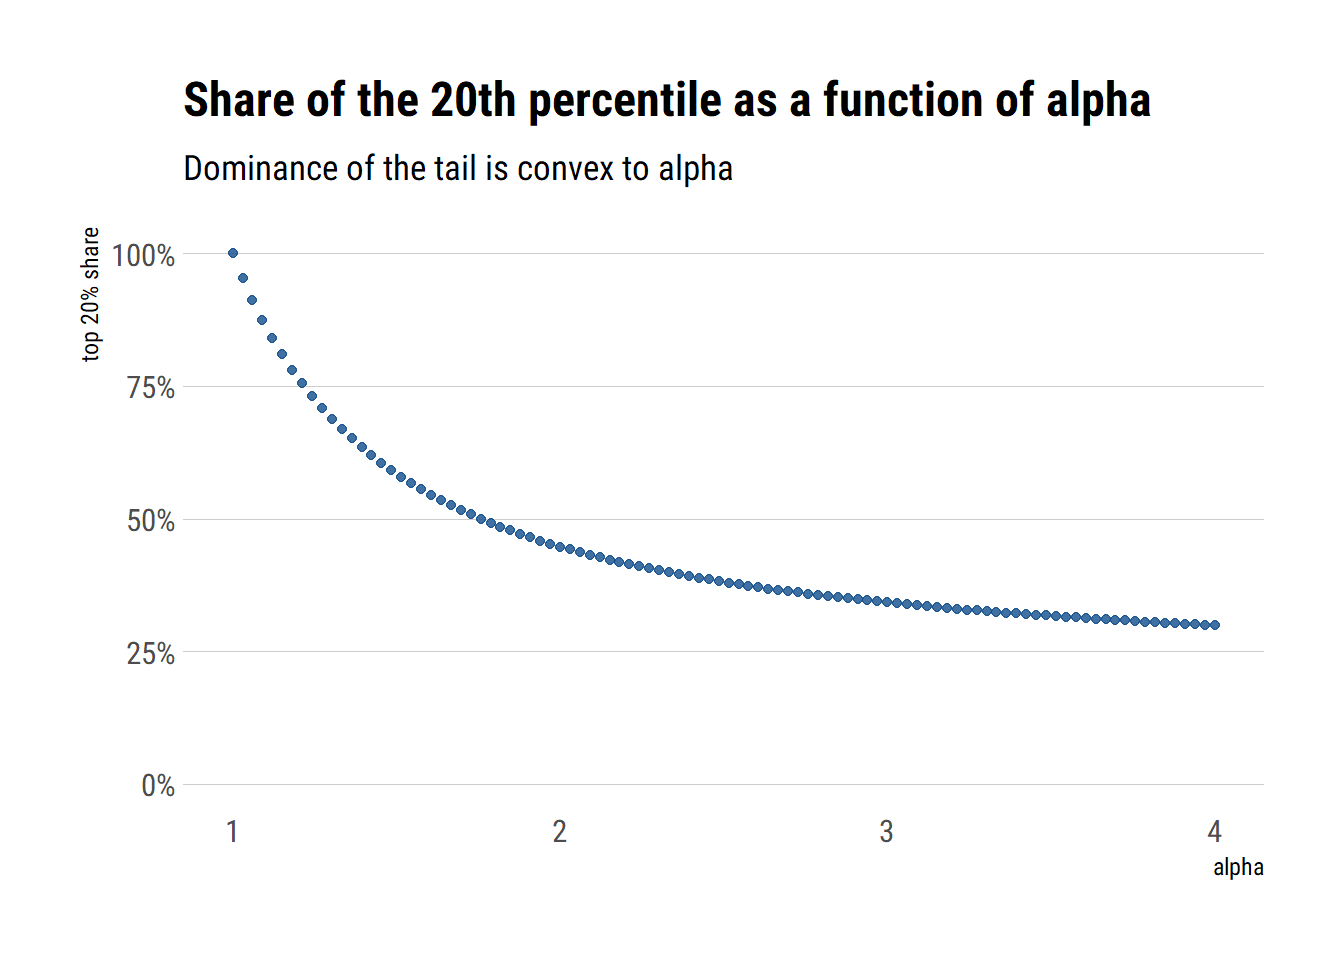
What proportion of the total does this extra bit represent? That depends both on
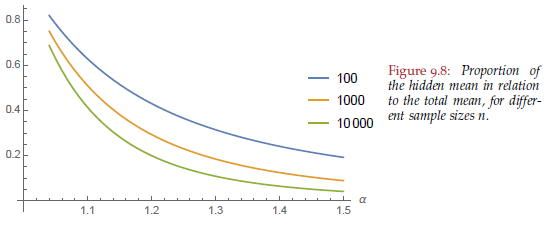 Source: Statistical Consequences of Fat Tails
So for an enterprise software company with
That number is conservative — it assumes that we've already acquired every customer up to a certain size, thereby maximizing monetization of customers equal to or below that size. We haven't really done this though, so even current monetization underestimates how well we could monetize, even without acquiring larger customers. Factor that in, and the degree to which we underestimate true monetization only increases.
Combined, the above insights form a mathematical justification for "land and expand"-style go-to-market strategies.
Here, land and expand is effectively an indexing strategy — land at as many organizations with as little investment as possible. Every once in a while you'll land a Google, a Facebook, or an Amazon (both figuratively and literally) which will drive a disproportionate share of revenue.
Even if those customers start off small, any given customer could potentially become quite large.
Further, it can make sense to overspend somewhat on establishing those small beachheads, as they likely underestimate the true average contract value. For this reason, common metrics for evaluating the efficiency of software sales like the "magic number" may underestimate the efficiency of land and expand models, especially during the land phase.
If we suspect right-skewness, the true mean is more likely to be underestimated by measurement of past realizations, and the total potential is likewise poorly gauged. — The Fourth Quadrant: A Map of the Limits of Statistics
In fact, one of the best software investments I ever made (that shall remain nameless) was in a company that on its face seemed quite inefficient, with a magic number well below 1. The leadership team preached the virtues of its land and expand model, but our static analysis of its sales metrics was doomed to underestimate its true efficiency, even after many hours spent (by yours truly) wrangling and analyzing the data.
Luckily, we got over our concerns and made what turned out to be a great investment.
With more mathematical context, the story is a visceral personal reminder to properly grapple with the implications and dynamics of fat-tailed software monetization.
This is just a small taste of fat tails, and I plan to write more in the coming months on their broader implications for high-growth startups. Much ink has been spilled on this topic within the context of venture investing, but not so much for operating the underlying businesses themselves.
Here's a preview of the topics:
I've been thinking about some of these essays for the better part of a year, so I'm excited to finally share these ideas.
Long-form essays on the economics of tech, with the data to back it up. All signal, no noise.
Read by 5,000+ founders, engineers, and investors.