The views of the news
We can quantify this differential impact by counting how often journalists attributed market volatility to ongoing pandemics or the accompanied policy responses. Researchers did exactly this, and what they found was striking:
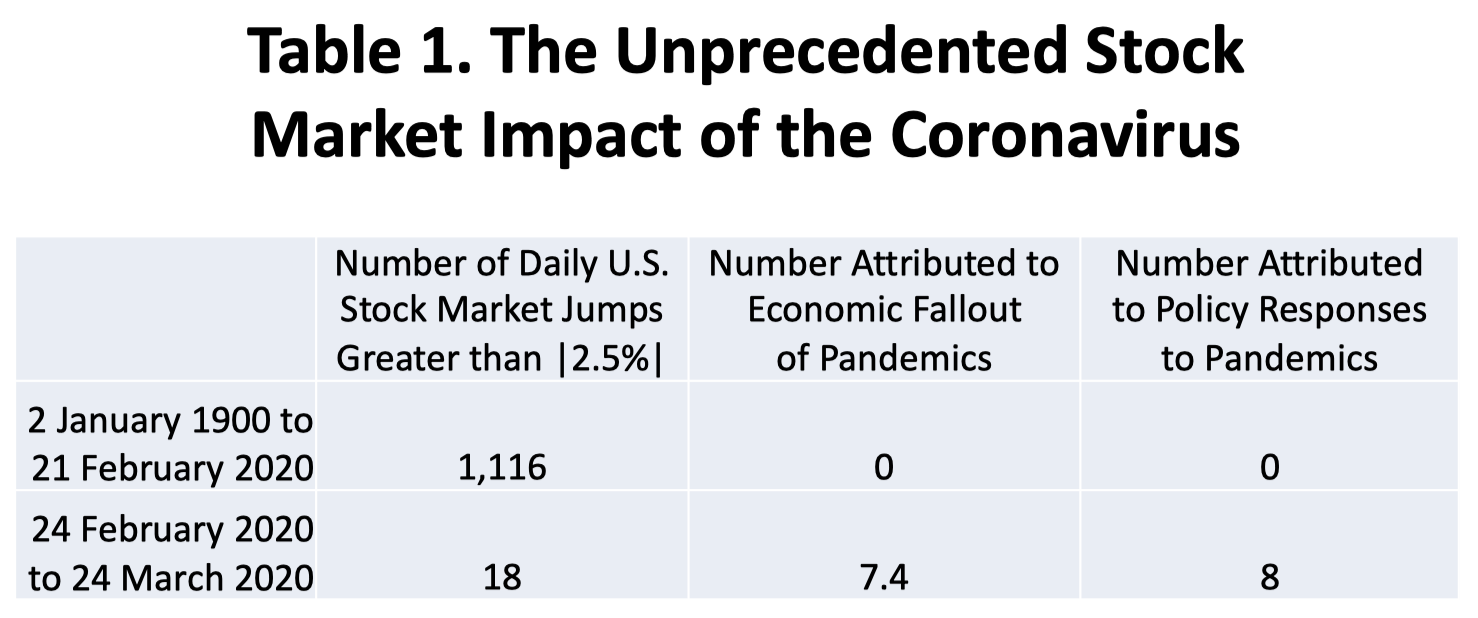
Of the 1,116 times since 1900 the stock market moved more than 2.5% in a single day prior to the Coronavirus, not once was the jump attributed in any way to a pandemic. Not once.
In contrast, of the 18 days between February 24 and March 24, 2020 where the market moved more than 2.5%, journalists attributed 7 days to the coronavirus and 8 to the federal government's response to the virus. In other words, 15 of the 18 episodes of high volatility were virus-related. This suggests updated information about the coronavirus caused nearly all outsized market movements.
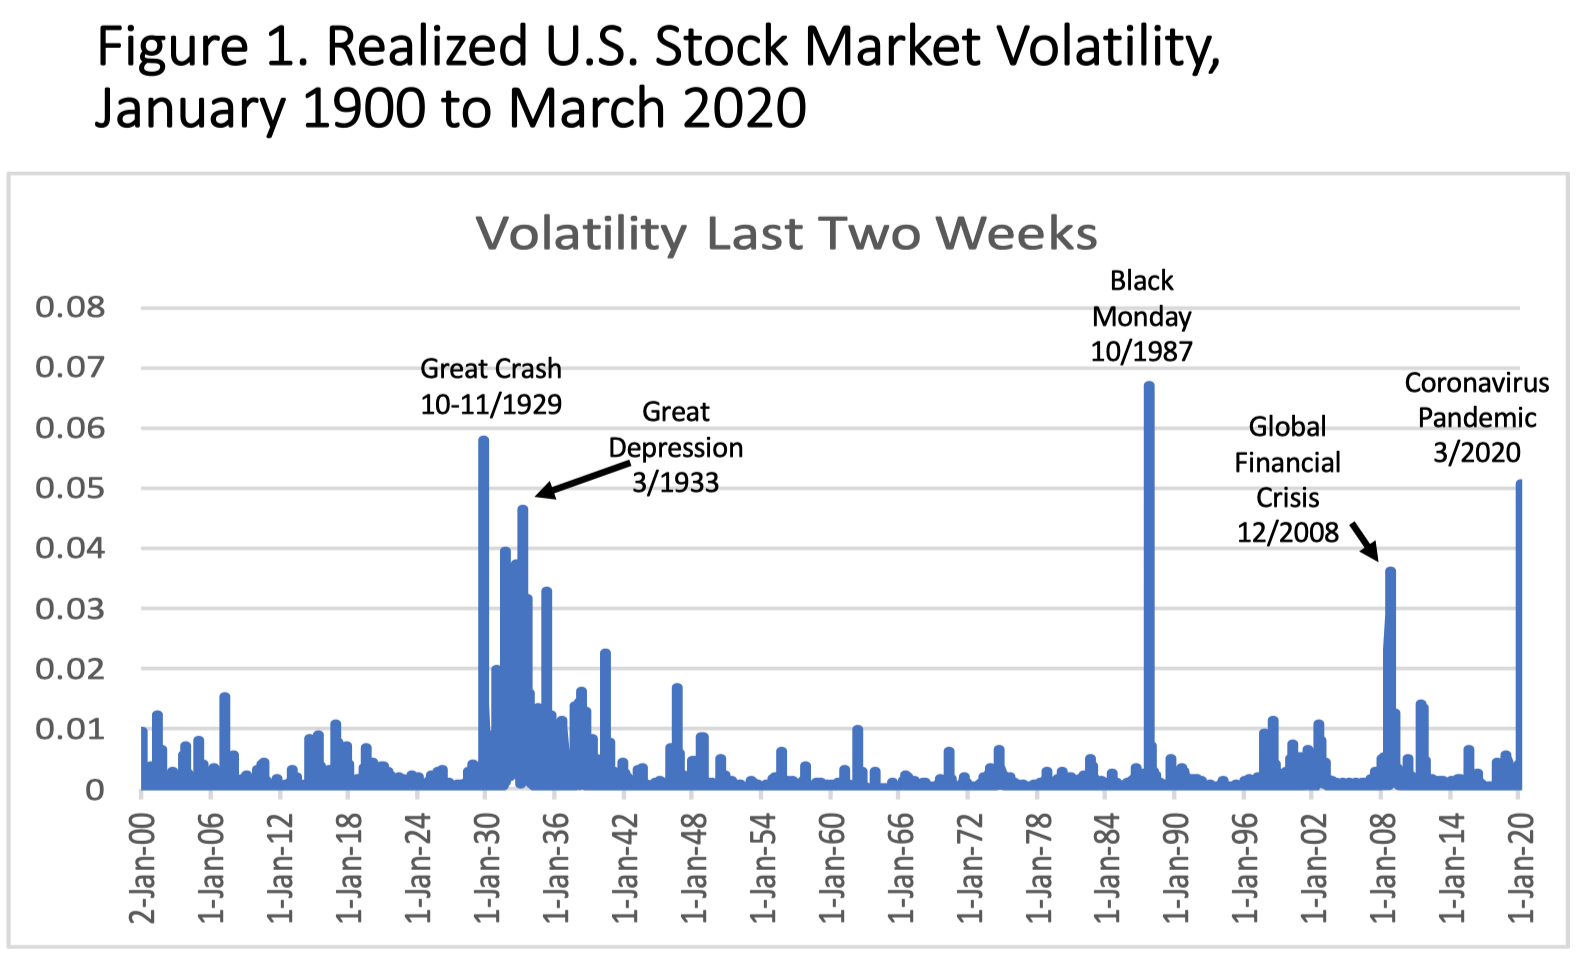
In the words of the researchers, "no previous infectious disease episode led to daily stock market swings that even remotely resemble the response in the past month to the COVID-19 developments."
Let’s stay on this theme of news coverage and look at this another way. Take the percentage of news articles talking about volatility, and subset those that mention an ongoing infectious disease pandemic. Here's what the same researchers found across multiple disease episodes:
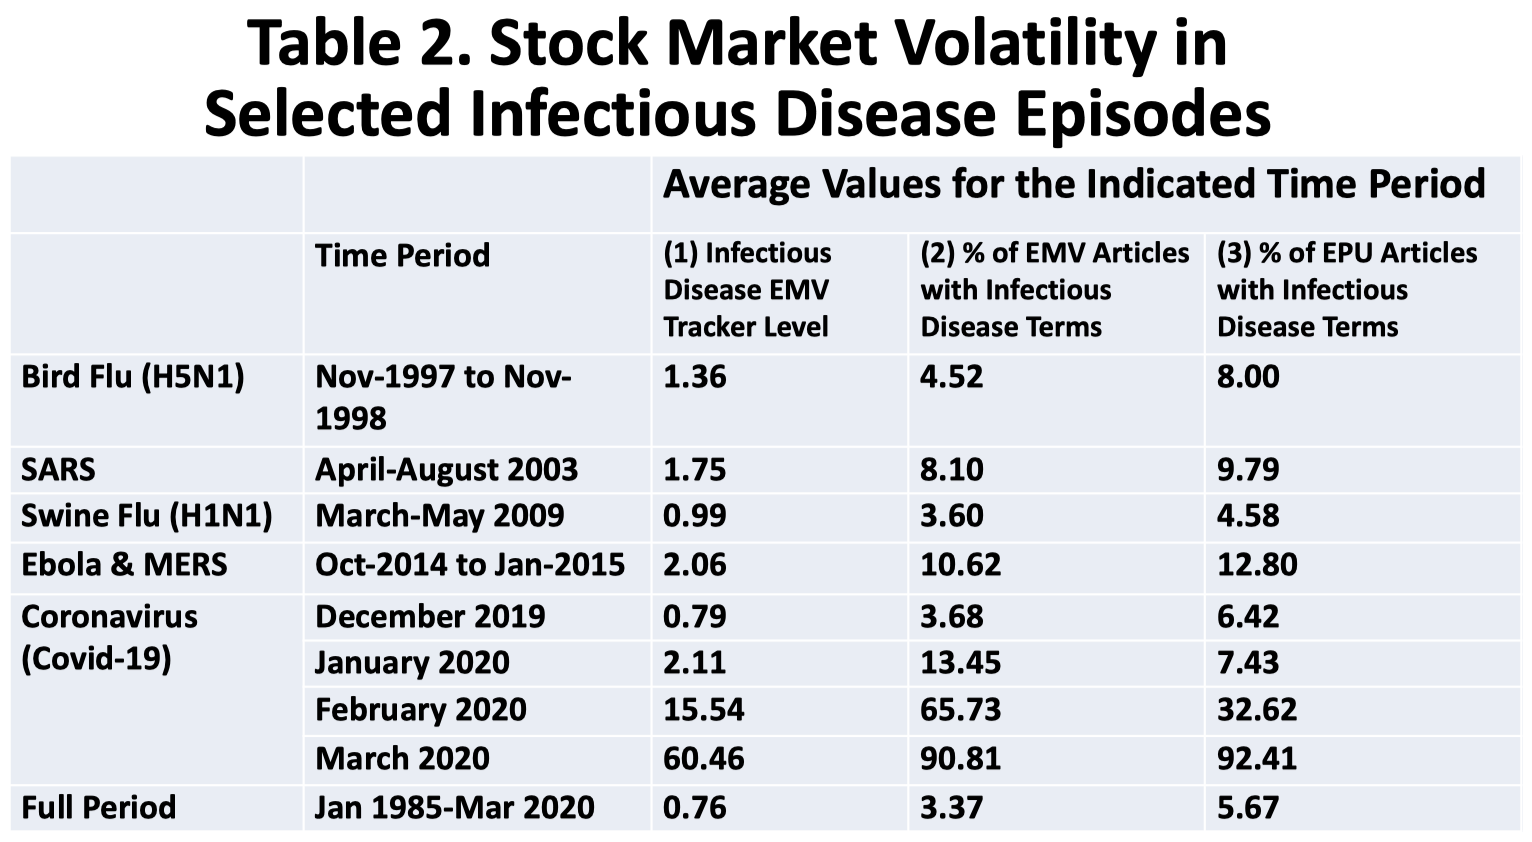
Coronavirus reigns supreme. Focus on the column “(2) % of EMV Articles with Infectious Disease Terms”, where you can see the ramp in volatility coverage mentioning the coronavirus. 91% of volatility-related news articles in March 2020 mentioned the coronavirus. This compares to peak news share of 5% for the Bird Flu of 1997-1998, 8% for SARS, 4% for Swine Flu / H1N1, and 11% for Ebola and MERS.
Can we trade on this?
Ok, so the virus clearly drives volatility.
Let's take the next logical step — can we predict stock market movements using updated information on the virus? Even further, can we use predictions of the virus' spread to predict market movements?
According to one of my old economics professors, we can. Sort of.
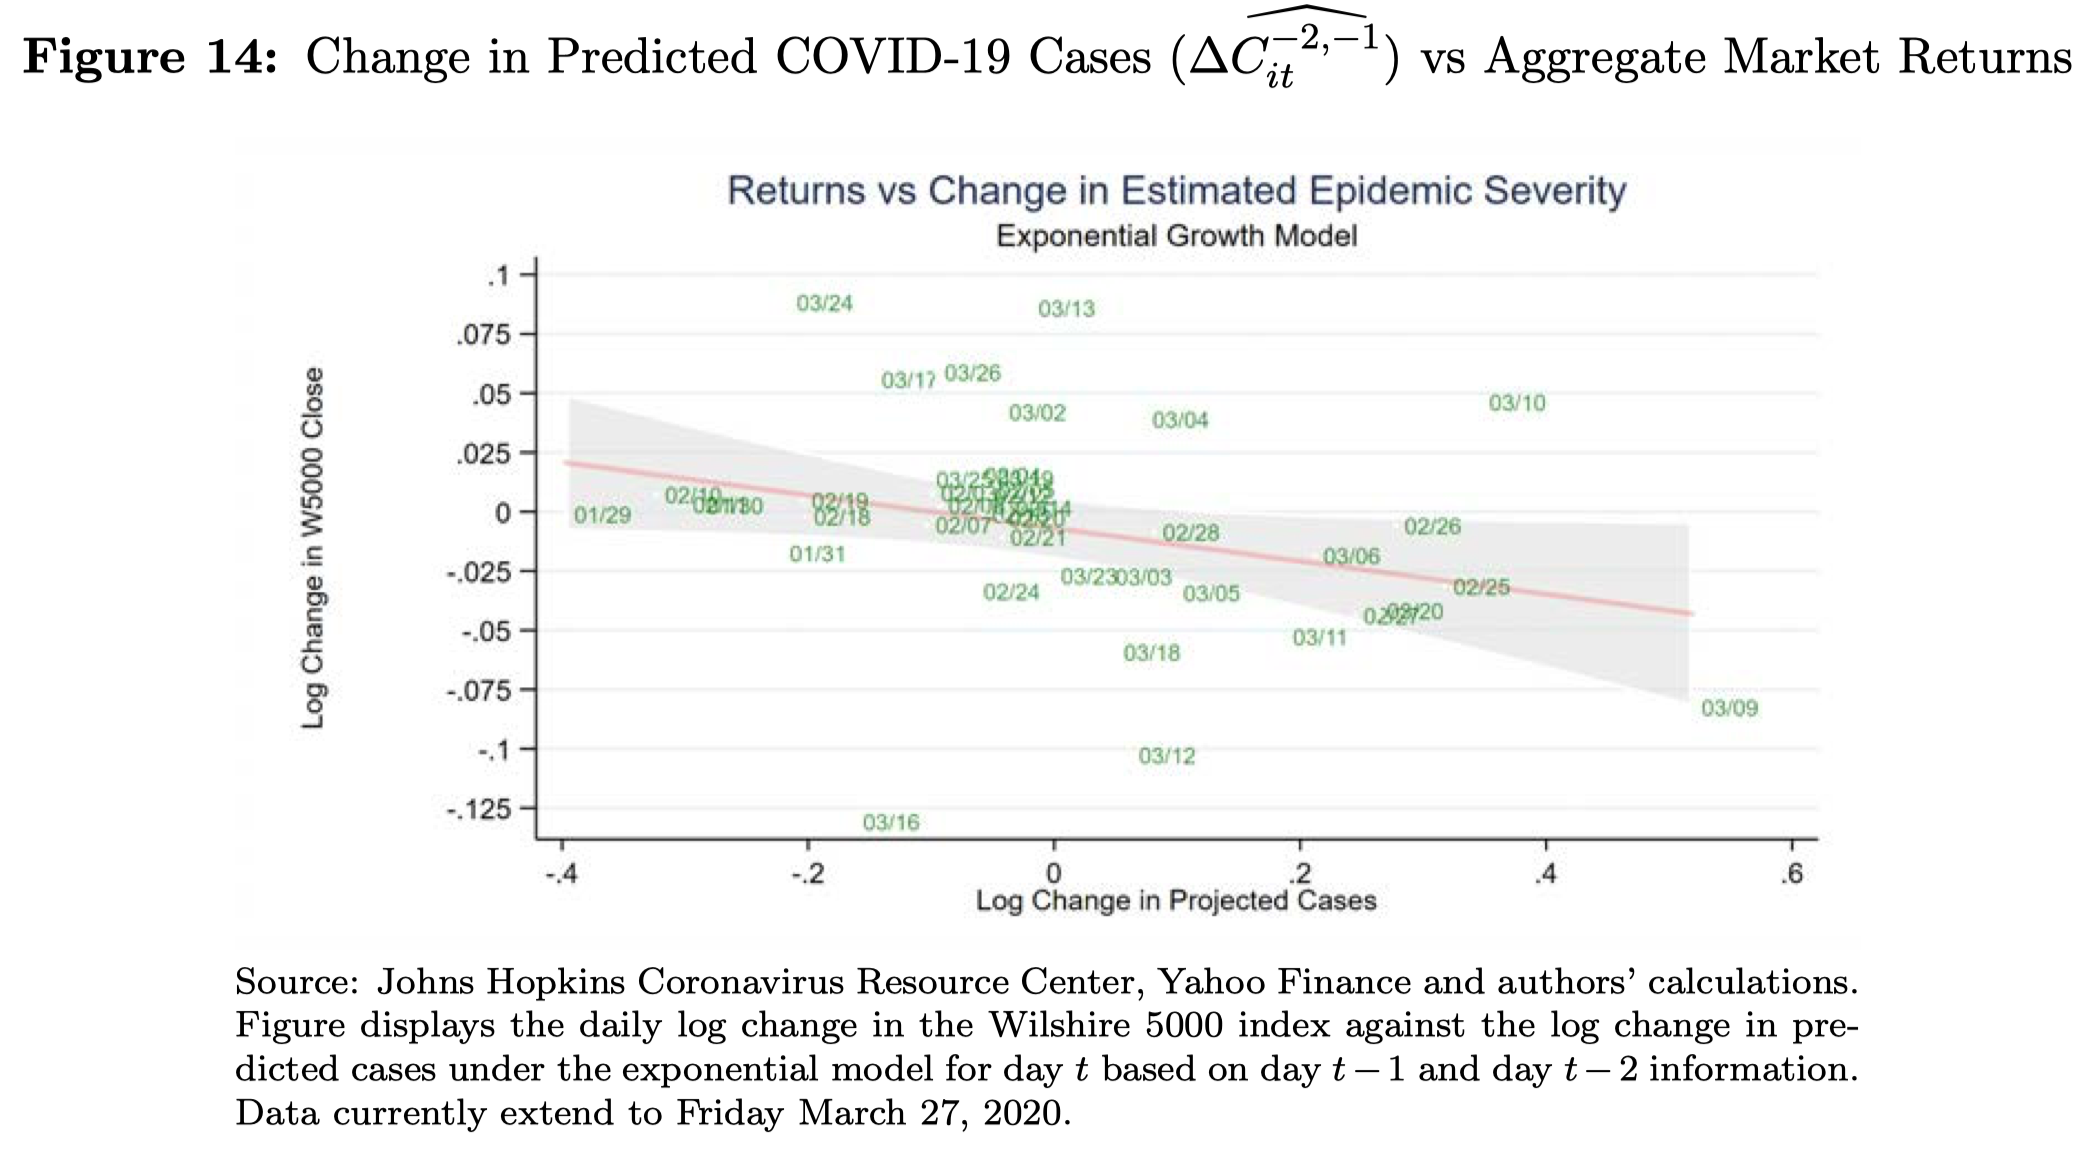
Peter Schott of Yale and a team of fellow researchers explore this idea with a simple exponential growth model of COVID-19. They trained the model on actual data, updating its forecasts for every additional daily data point, noting how the model's predictions change day-to-day. These updates represent the predictive value of the daily stream of new information about the spread of the virus.
They then plotted these prediction updates against the daily changes of the Wilshire 5000 index, which you can see below. They found a noisy but negative relationship between projection updates and the stock market:
They go further and estimate linear regressions of this relationship, summarized below:
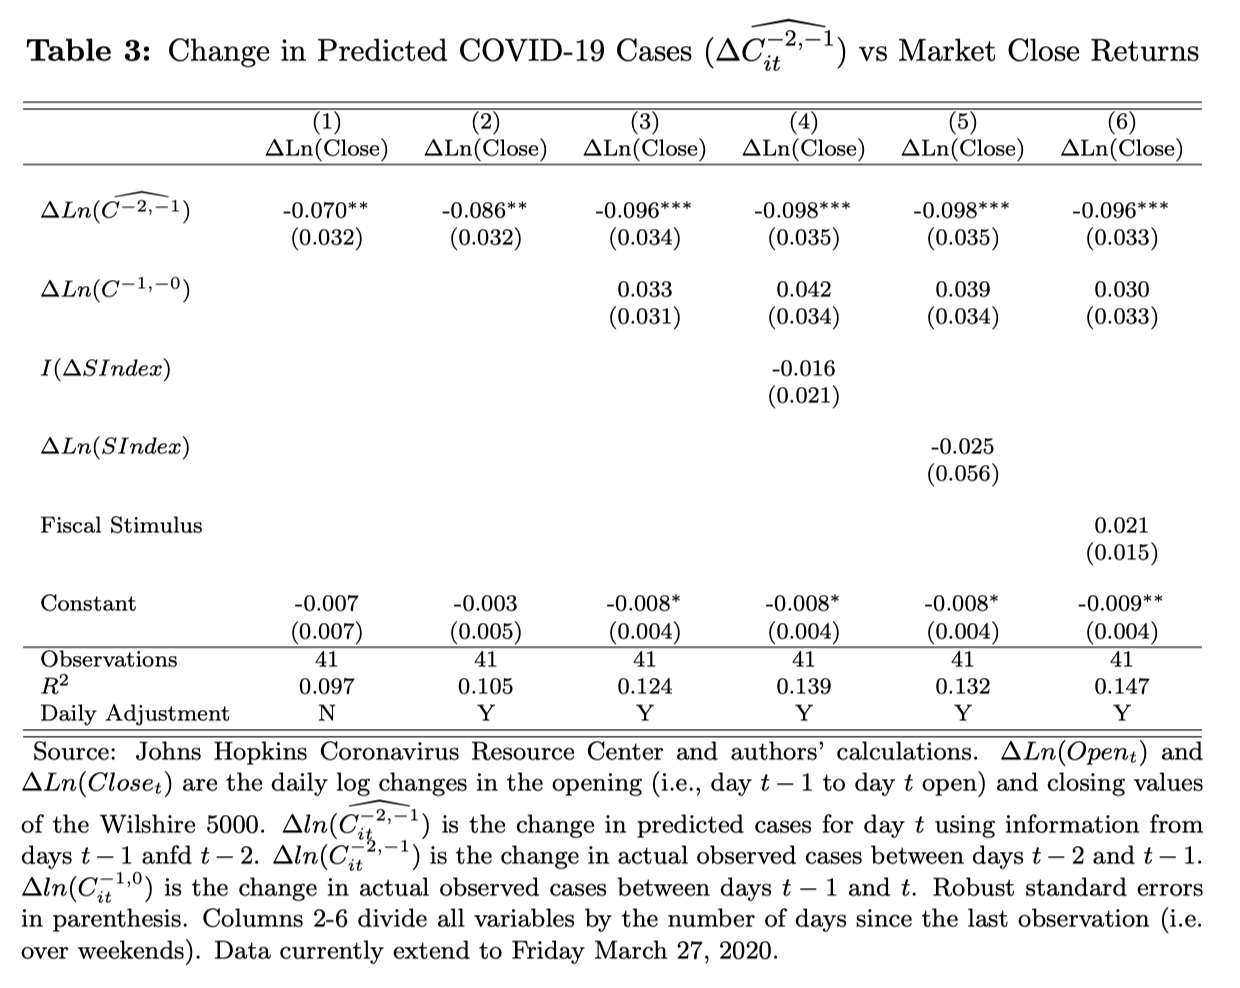
Focus on column (2). The coefficient of -0.086 implies that a doubling of predicted cases leads to a 8.6% lower closing price for the Wilshire 5000 index on that same day. Scaling this down, a 10% increase in predicted COVID-19 cases yields a 0.86% drop in the market.
Per columns (5) and (6), the relationship holds even after controlling for the government’s response to the virus, showing that we can separate the impact of the virus itself from the impact of our response to the virus.
Let's not get ahead of ourselves. Though the relationship is statistically significant, the R^2 of the regression is only 0.105, which simply means you can't predict the market very well using only an exponential viral growth model as your only input. The sample is also small, containing only 41 days of data. That said, there is clear informational value contained in these updated forecasts, which suggests they drive market movements.
The upshot
If epidemiological uncertainty drives stock volatility, volatility should taper as uncertainty declines.
This is happening right now, in real-time.
Though the crisis is far from over, our forecasts are improving. This is good news in a time of mostly bad.
Meanwhile, a paper out of the NY Fed this month shows the economic impact of the "sudden stop" in economic activity. This reflects not so much the virus itself but policy responses to the virus, which have been meaningful, if not always swift:
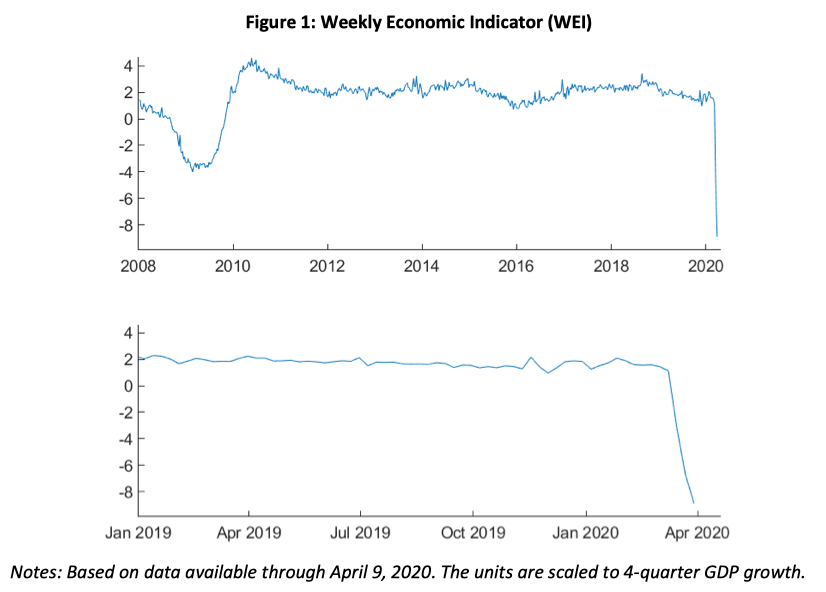
People often blame the severity of the Great Depression on misguided policies of the Federal Reserve, but this is a man-made recession like nothing we've ever seen.