Pre-Algebra
First, a quick math refresher:
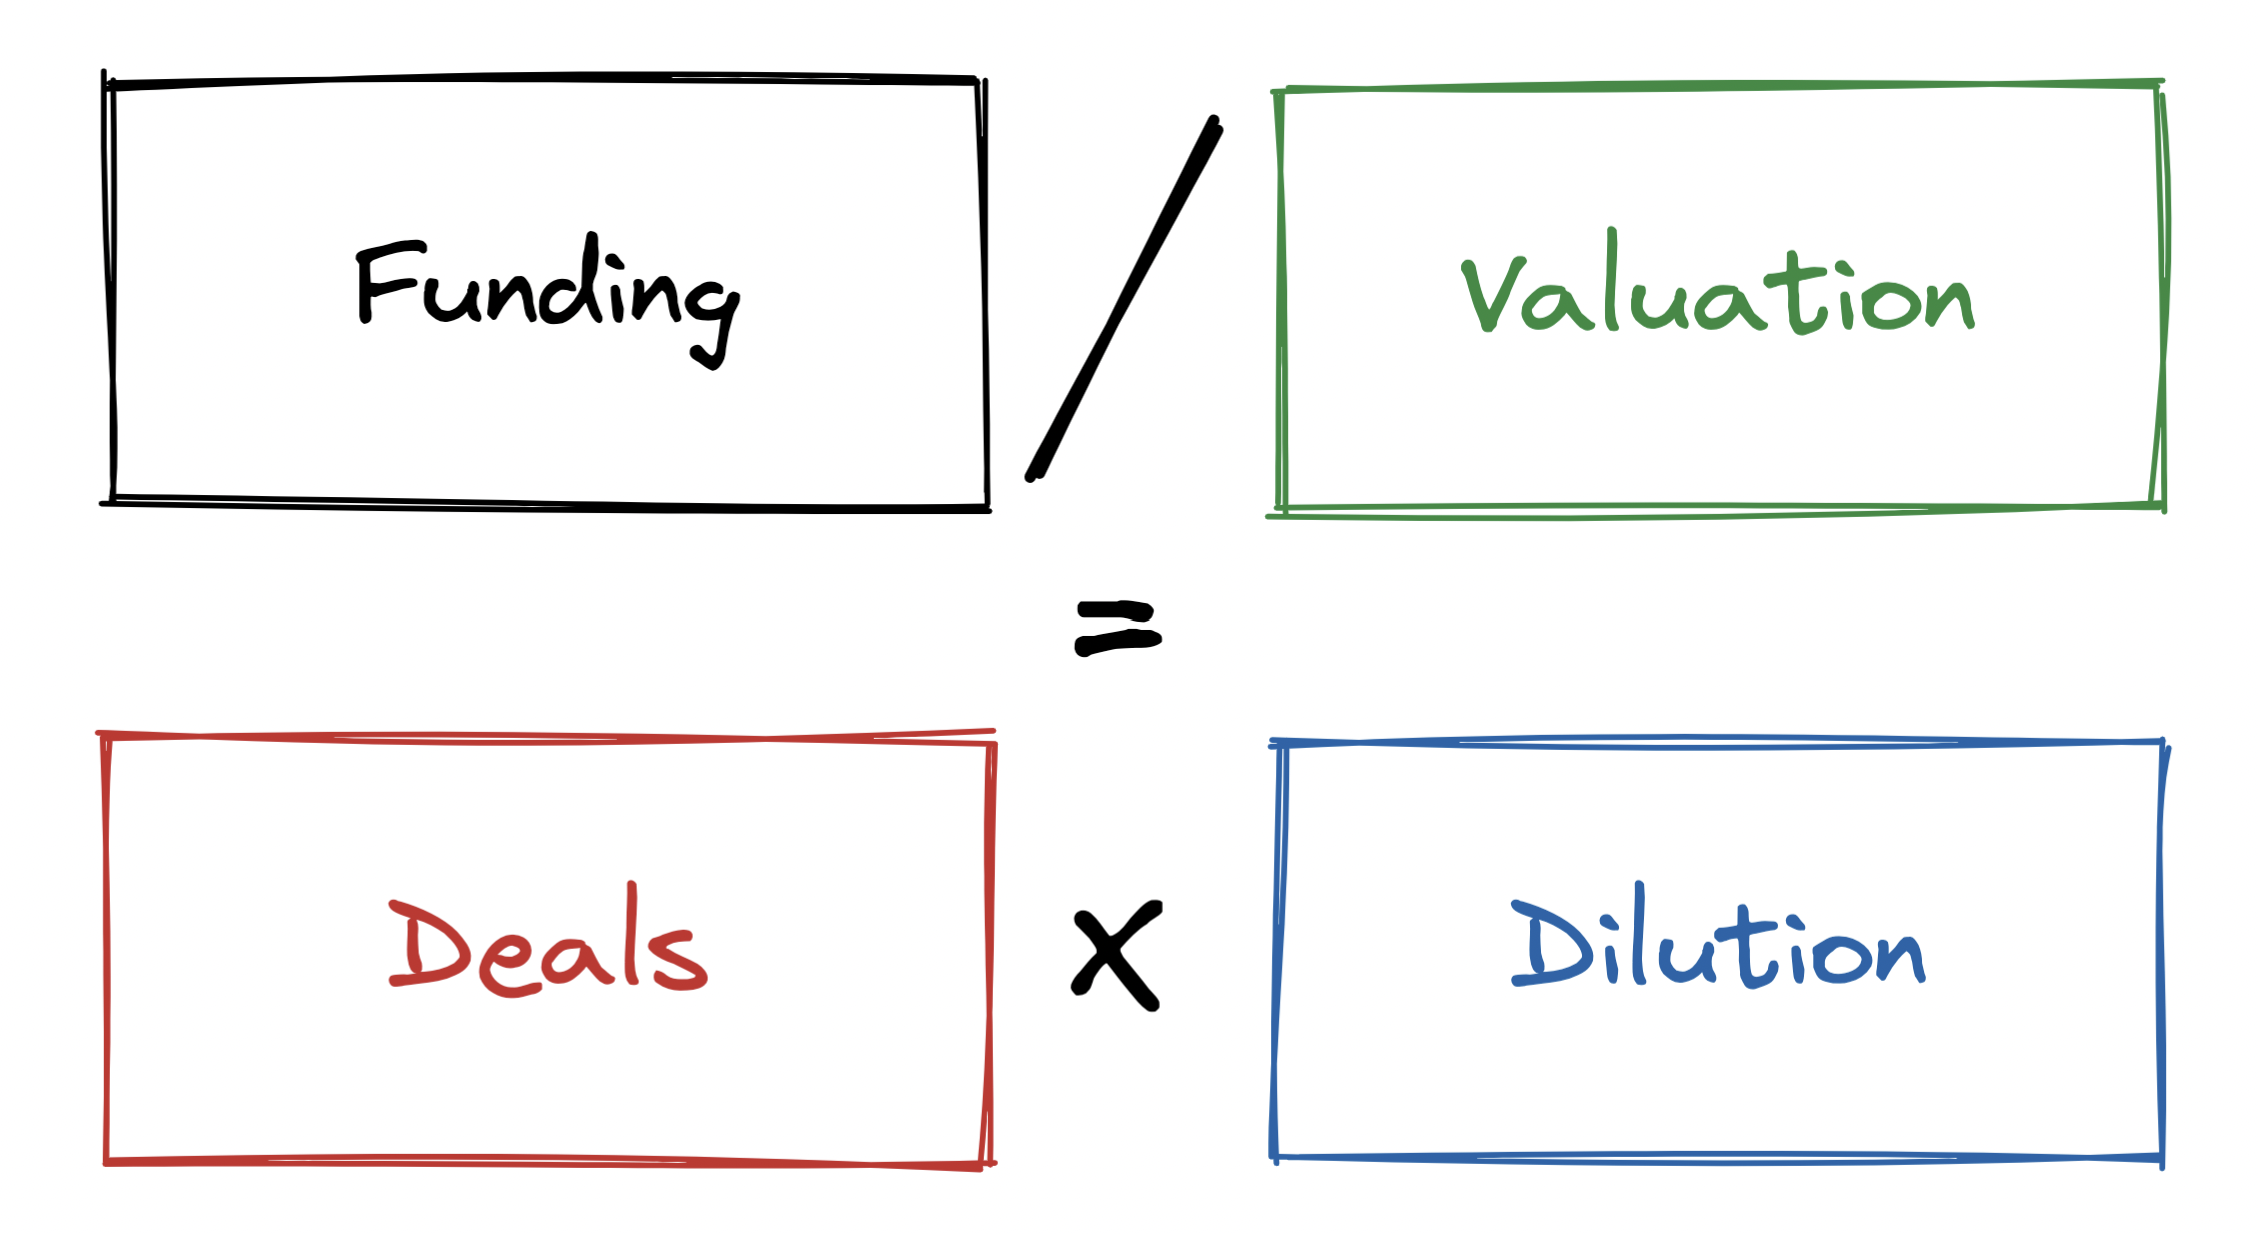
- Total funding volume equals the number of financing rounds multiplied by the average round size
- Assuming a standard equity round, average round size further separates into valuation multiplied by dilution (the proportion of shares sold to investors)
That gives us three components – deals, valuations, and dilution:
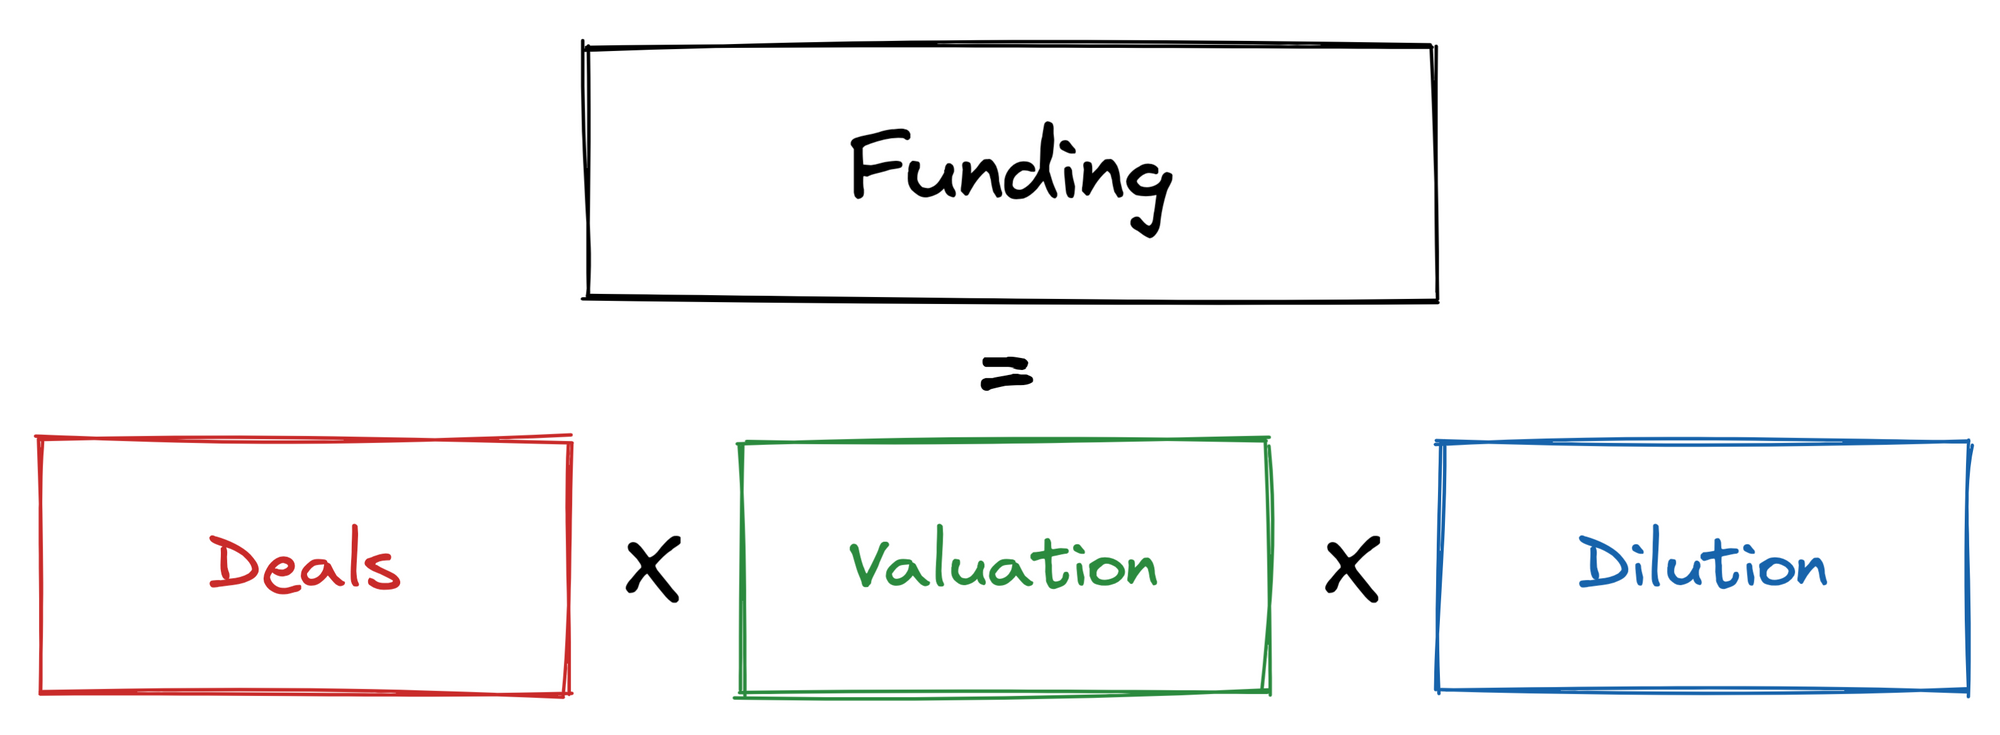
This framework is simple but powerful.
With it, we can explain the individual sources of growth in the venture funding ecosystem, cumulating into overall funding growth.
Algebra II
Let's walk through each component one-by-one.
I'll plot the growth over time of each component since 2010, leveraging data from Pitchbook for all venture deals completed in Western markets through 2021.
Importantly, I'll plot the cumulative log growth:
- This makes the components additive rather than multiplicative, which will help the analysis later
- This also means you can read compound annual growth rates (CAGRs) off of the y-axis. Just take the value on the y-axis and divide by 11, which is the number of years this analysis covers
Let's start with growth in funding volume by stage:
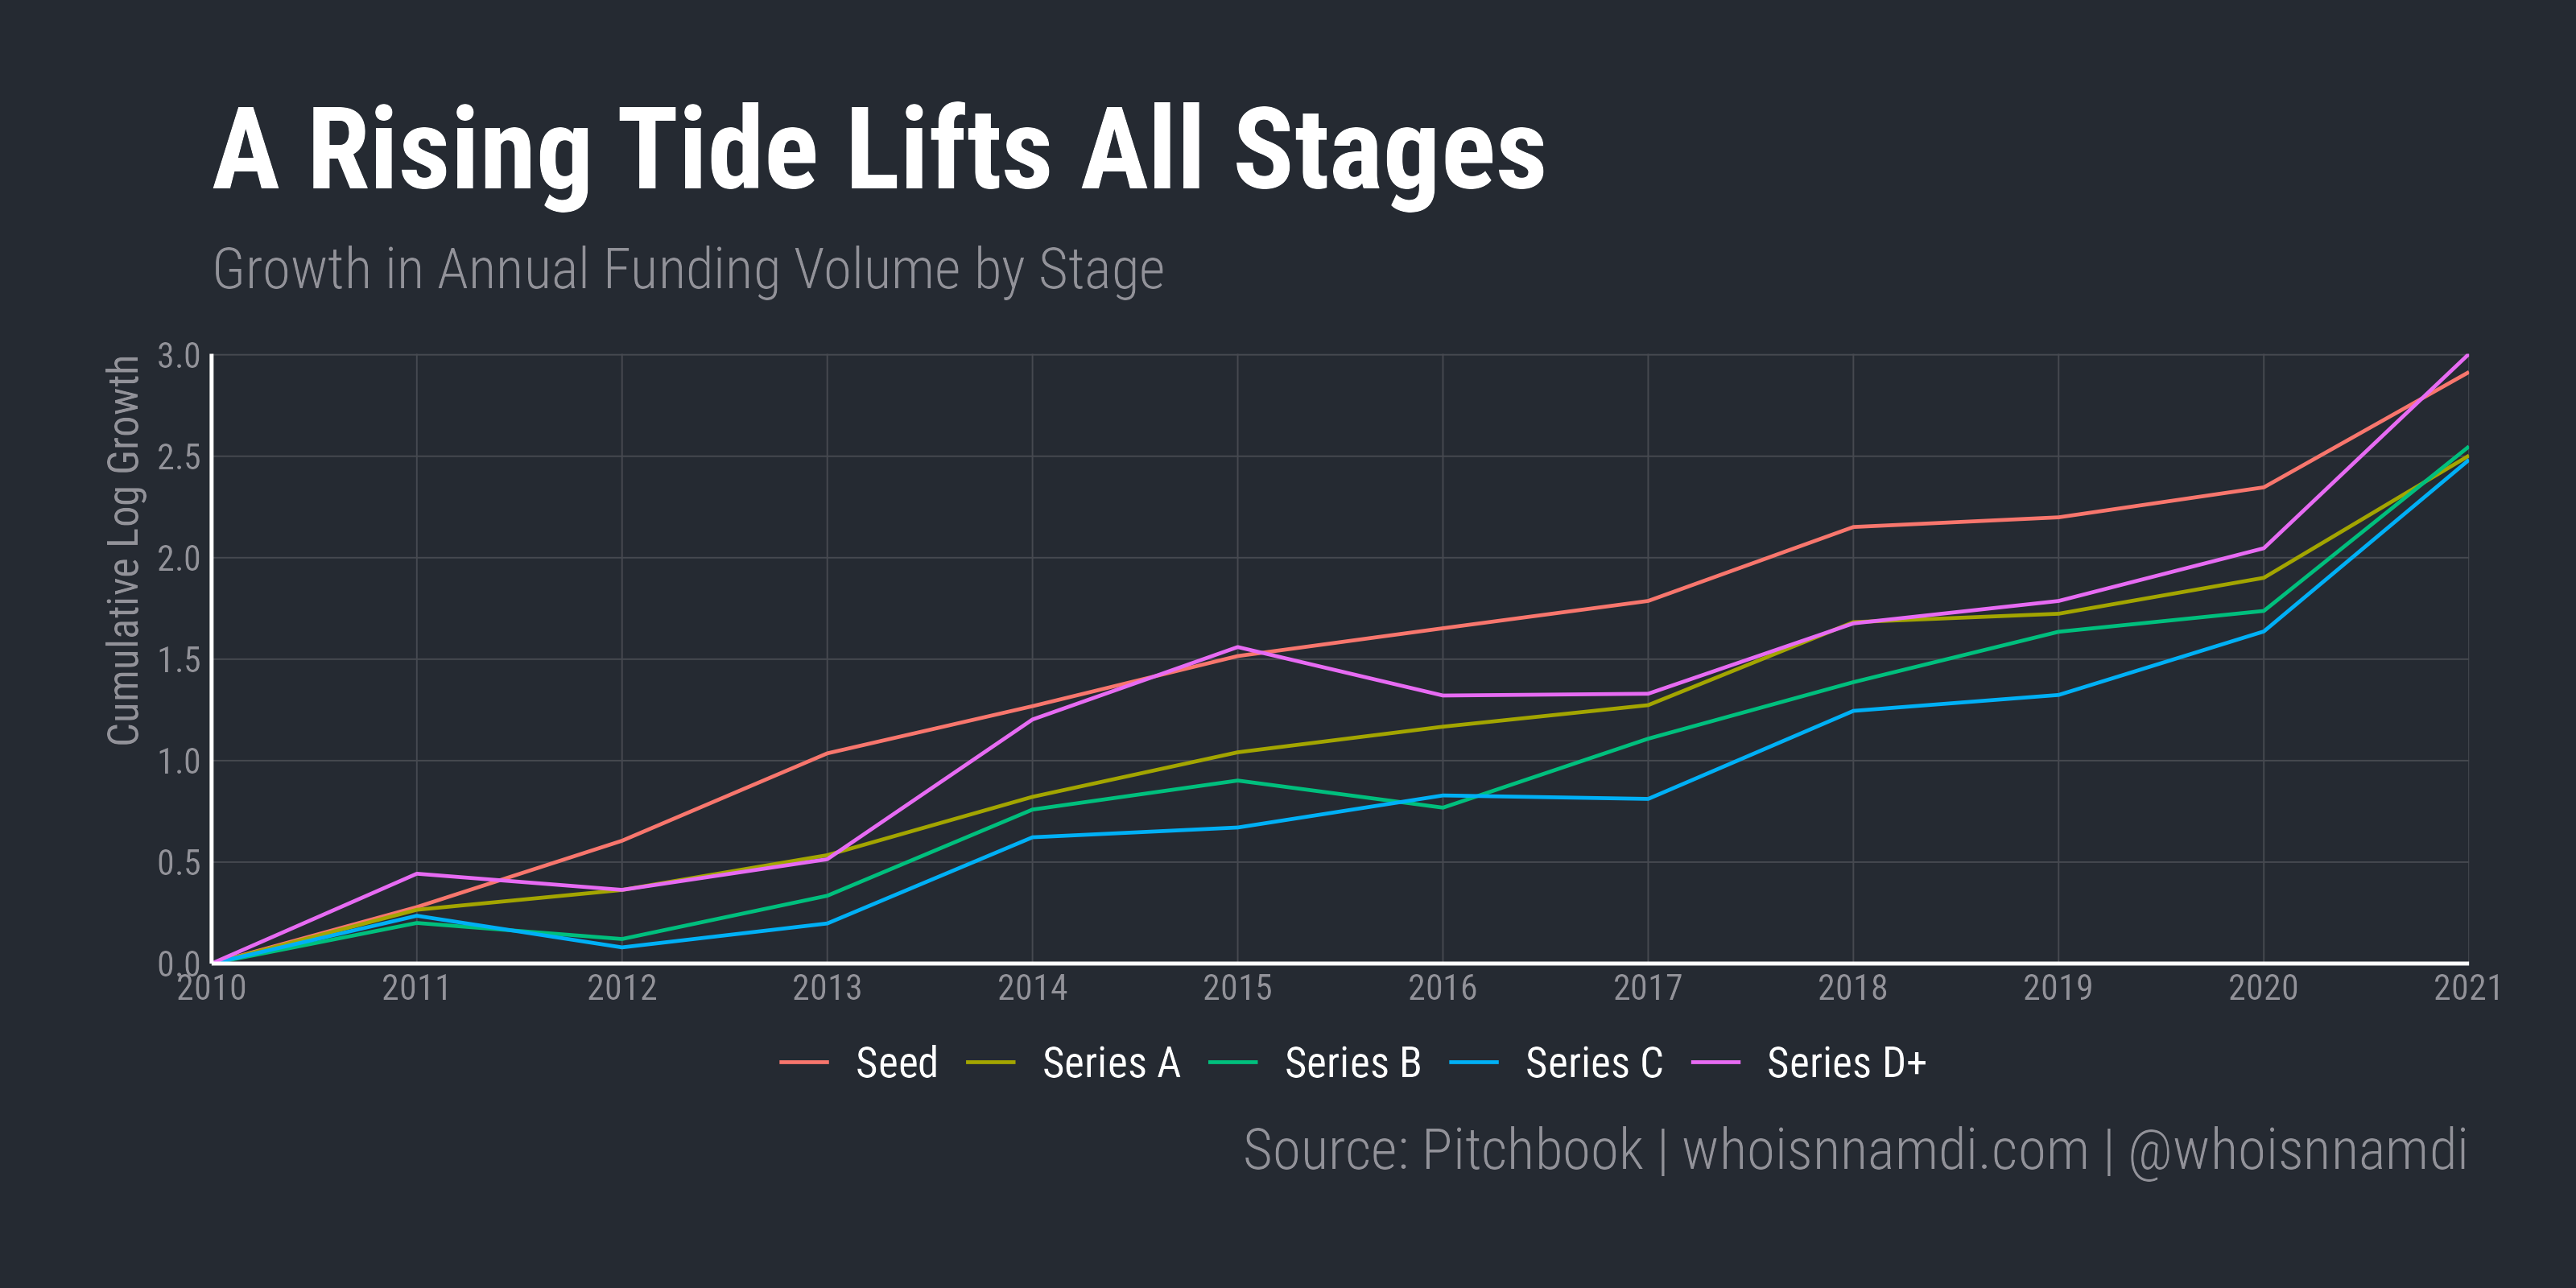
- Across stages, annual venture funding grew by 2.5 to 3 log points, with CAGRs ranging from 23-27% CAGR (again, just divide the log growth by 11)
- The earliest (Seed) and latest (Series D+) stages grew fastest
Next, let's dive into each of the components.
Deal counts have ballooned across all stages, but the Seed stage stands out:
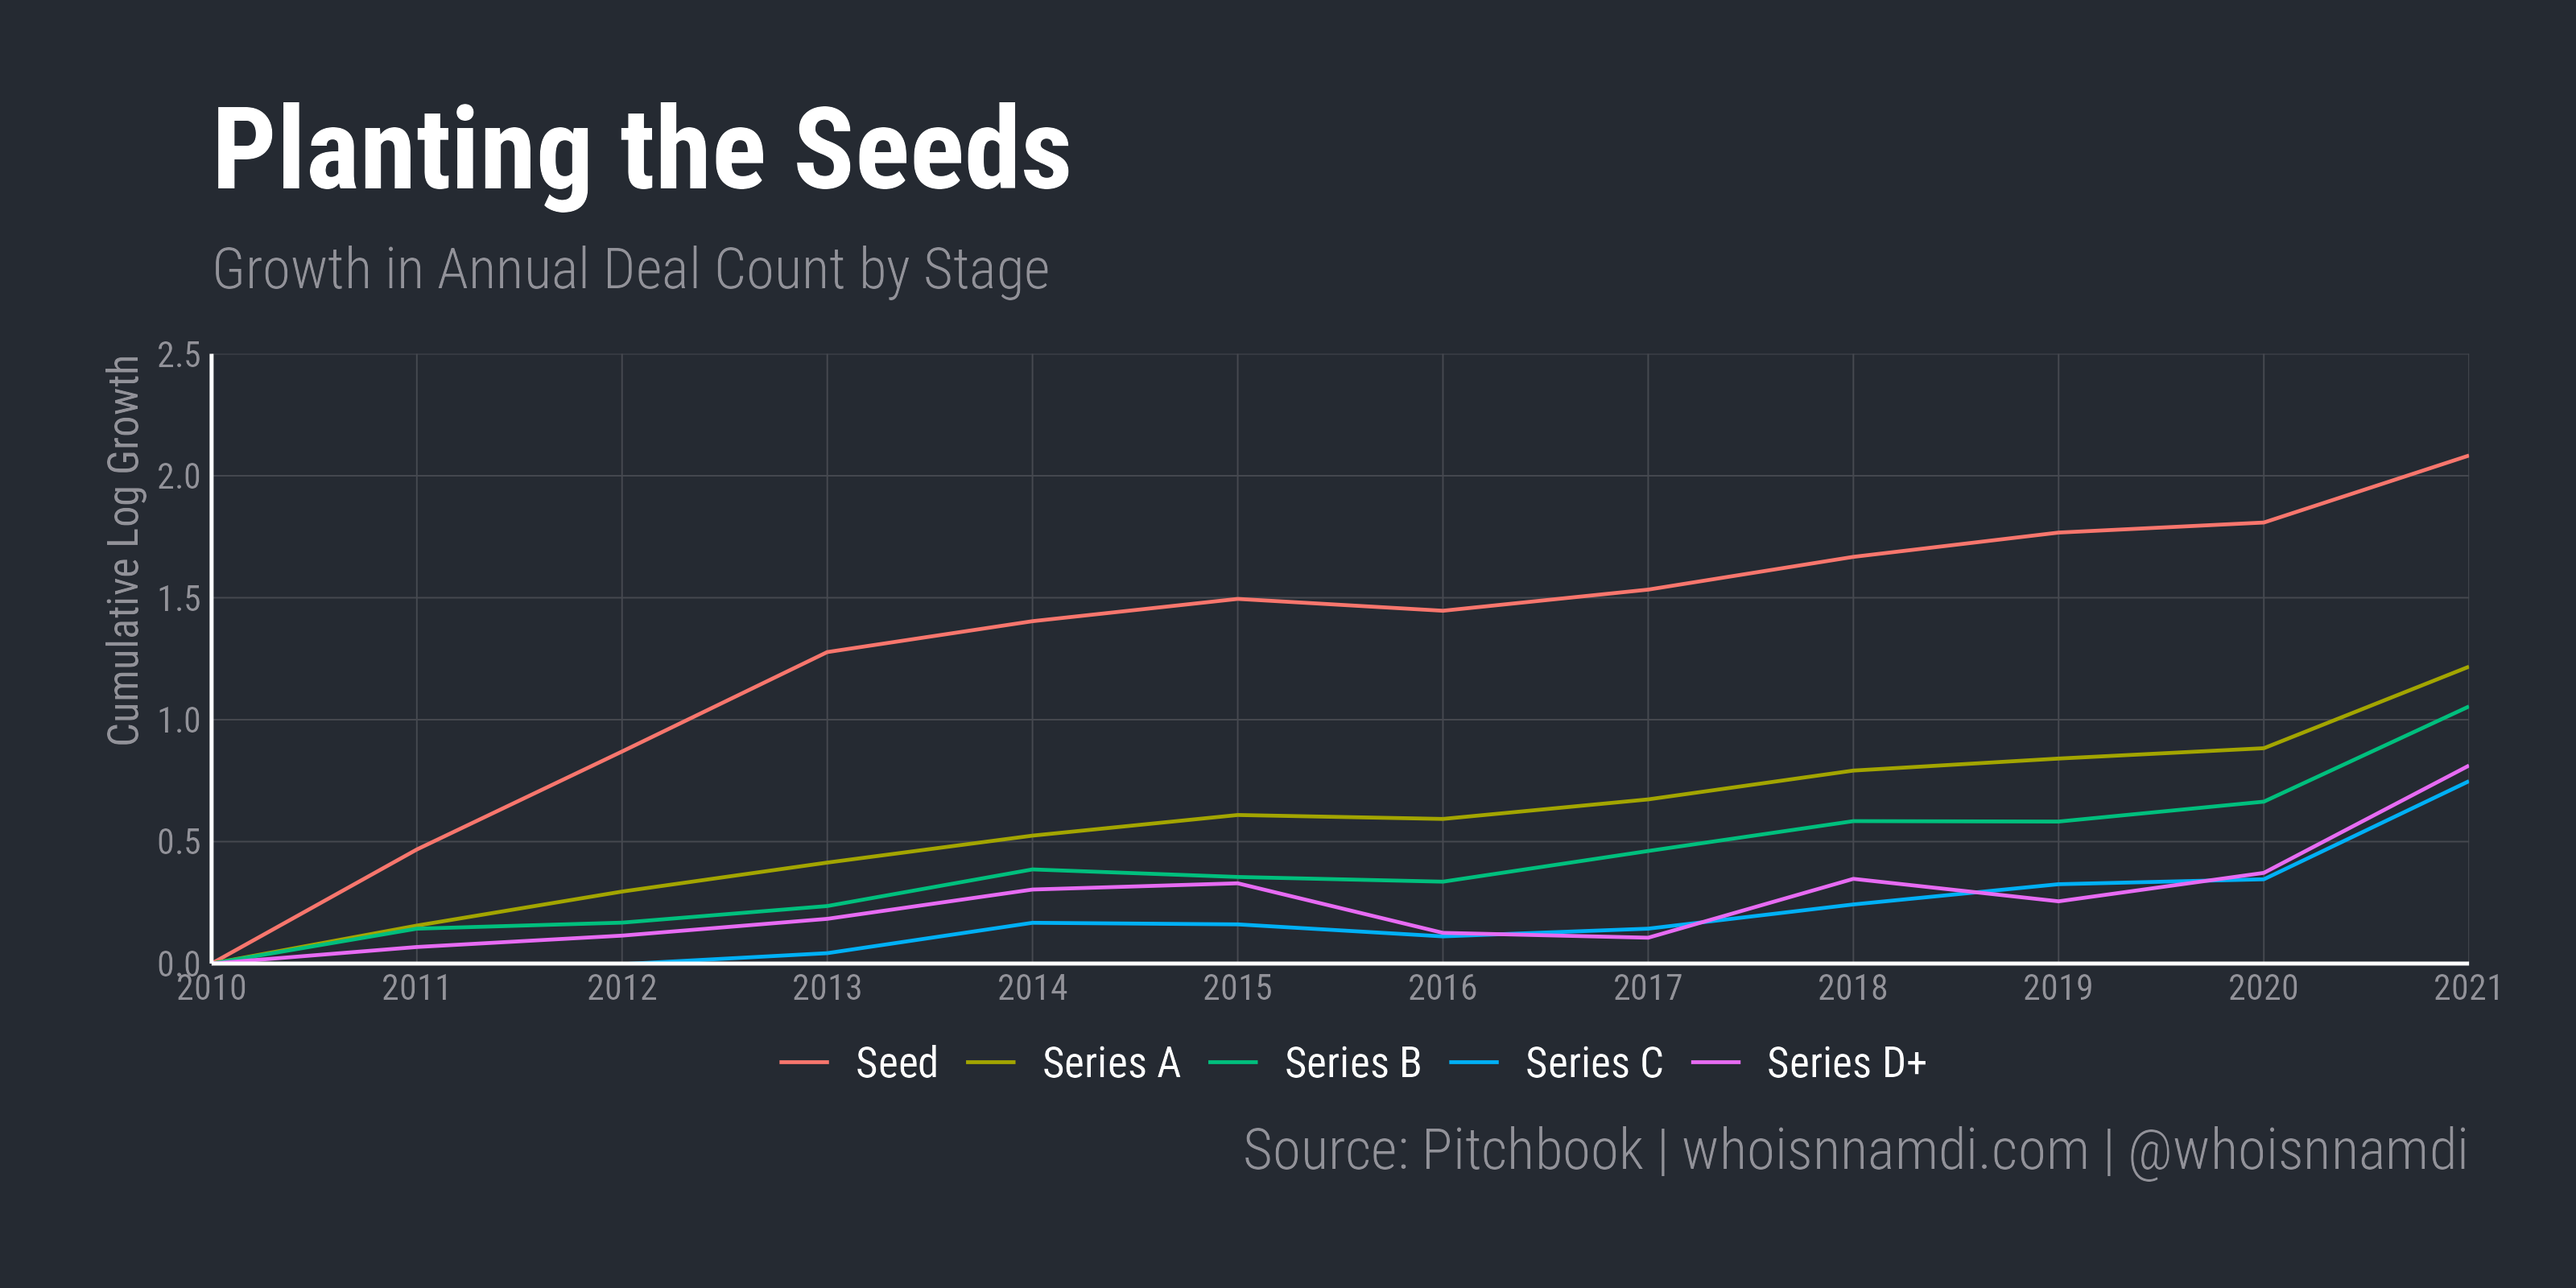
- Seed deals grew the most by far over this period, 2.1 log points or 19% on an annual basis
- On the other hand, Series C deals and later only grew ~0.75 log points, a 7% CAGR
- As and Bs were somewhere in the middle, growing 10% annually over this time
It should be noted: that Seed deals grew so much faster than the rest implies the "graduation" or "survival" rate of startups fell materially, as they've had more than enough time to mature.
More early-stage startups has not led to many more late-stage startups.
We'll revisit this.
Next up, valuations:
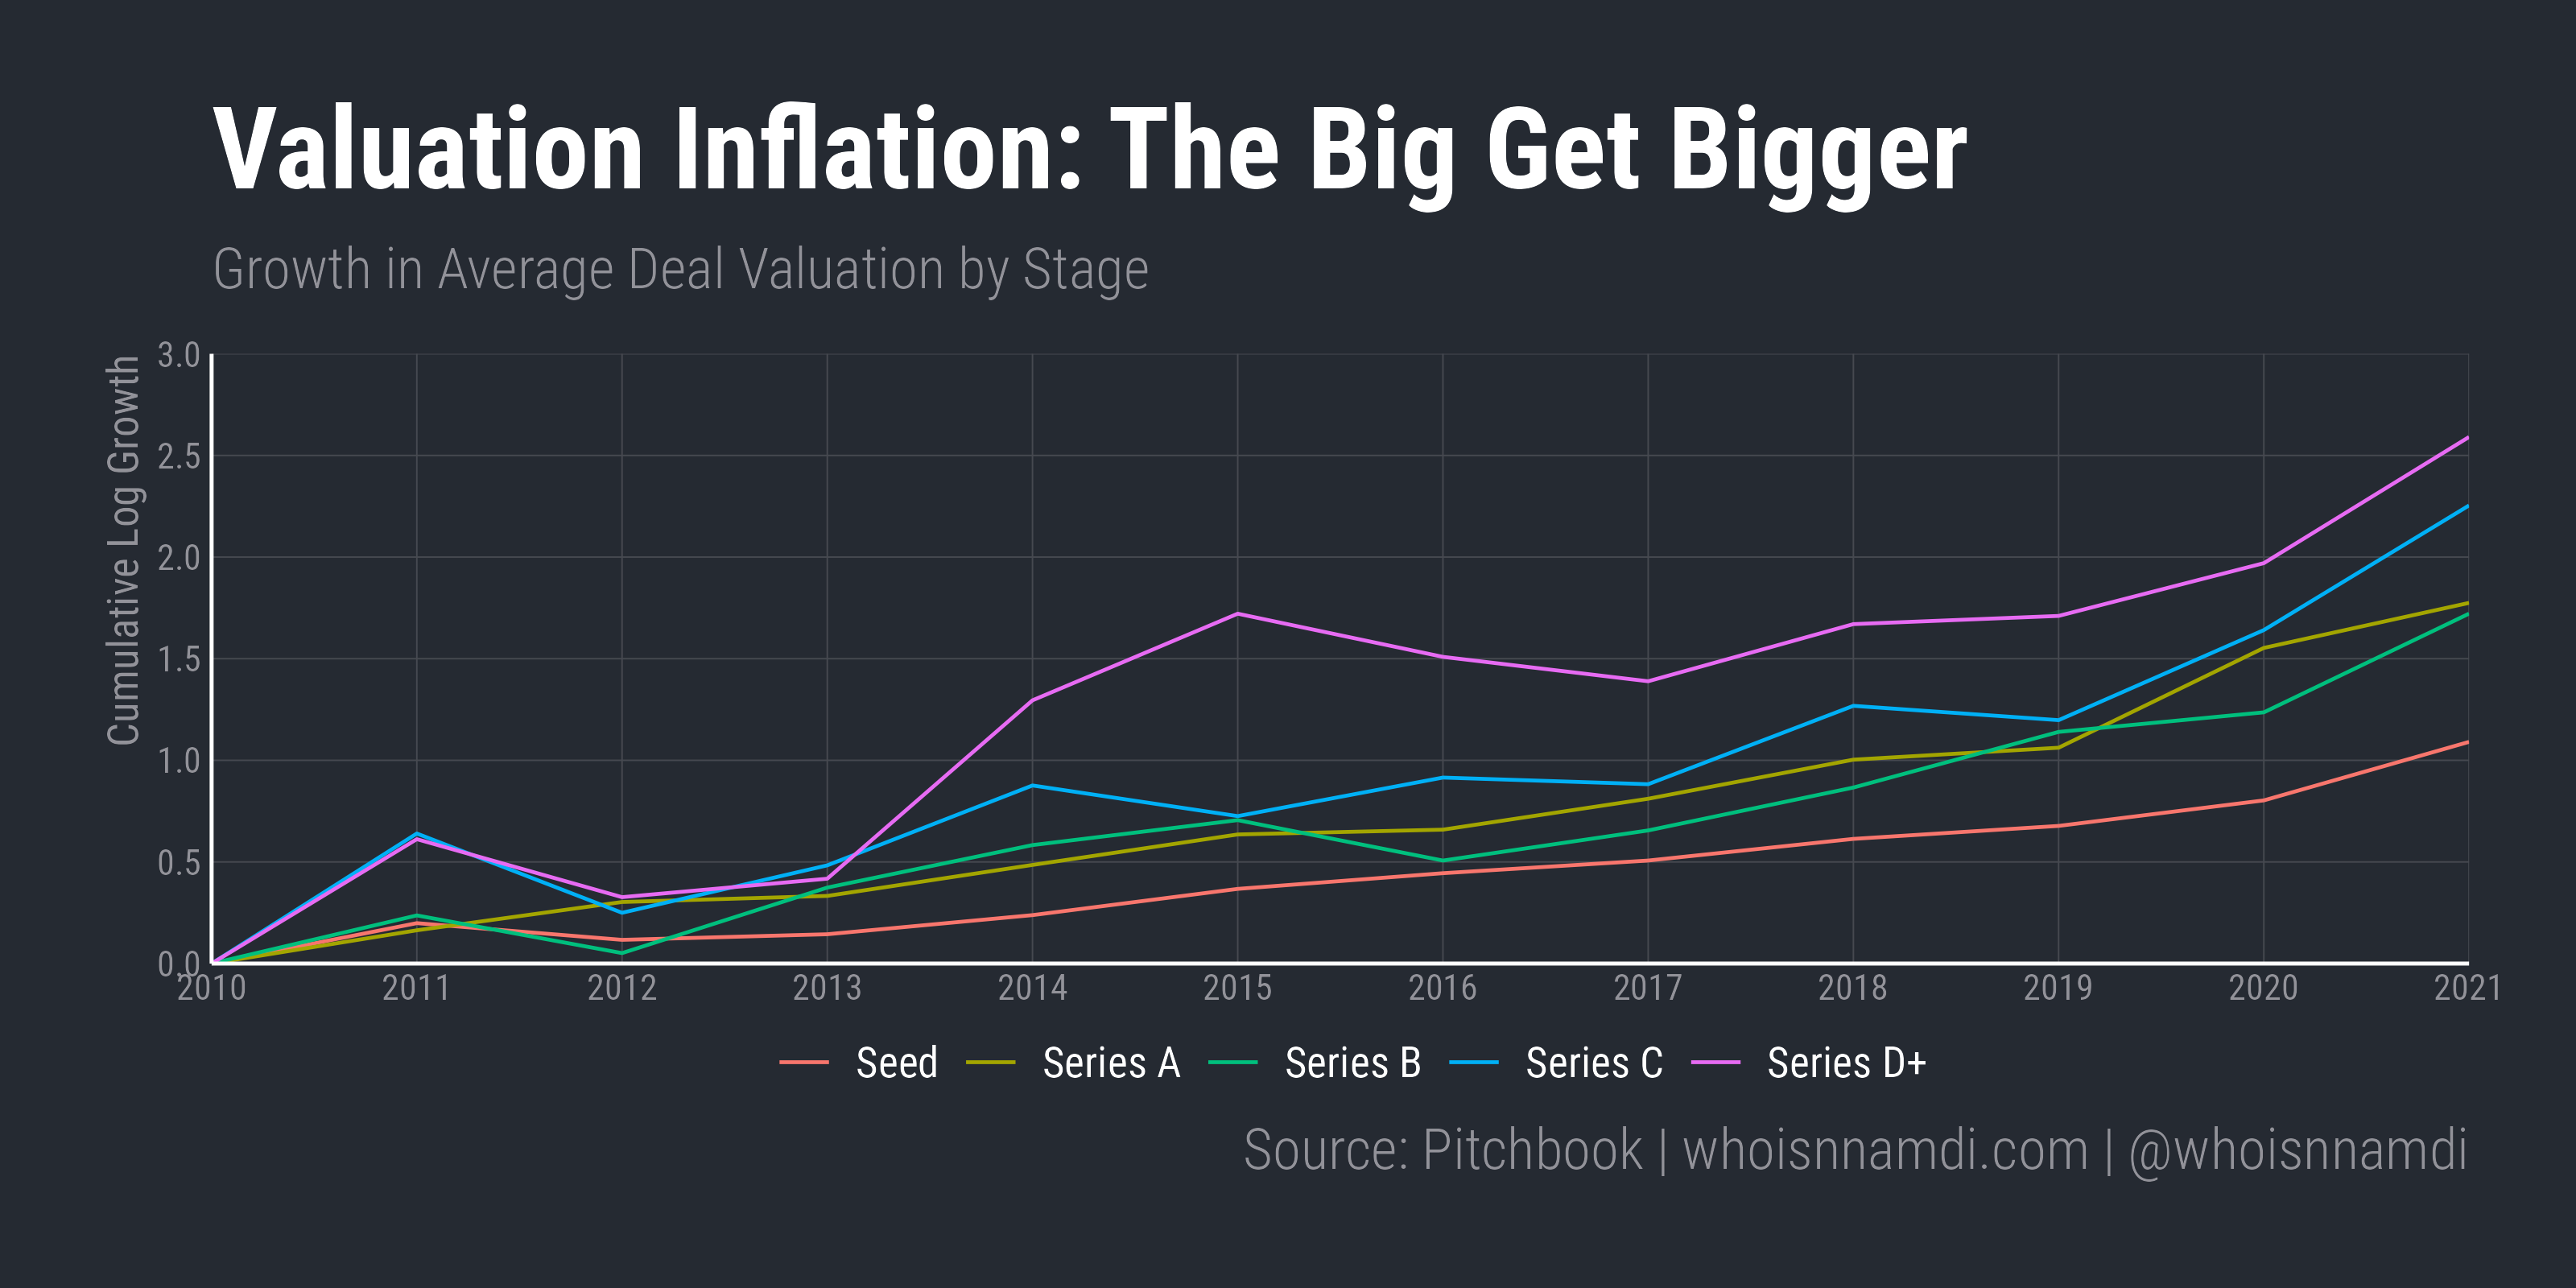
- Unlike deal counts, which grew the most at the early stage, valuations grew the most at the later stages
- Series C valuations grew at a ~20% CAGR, while Series D+ grew at ~24%
- Series As and Bs again formed the middle of the pack, growing 1.75 log points or 16% year-over-year
- Seed valuations "only" grew 10% annually, which is still exceptional if you think about it
Lastly, let's look at dilution. Note again these numbers are in log points (not percentage points):
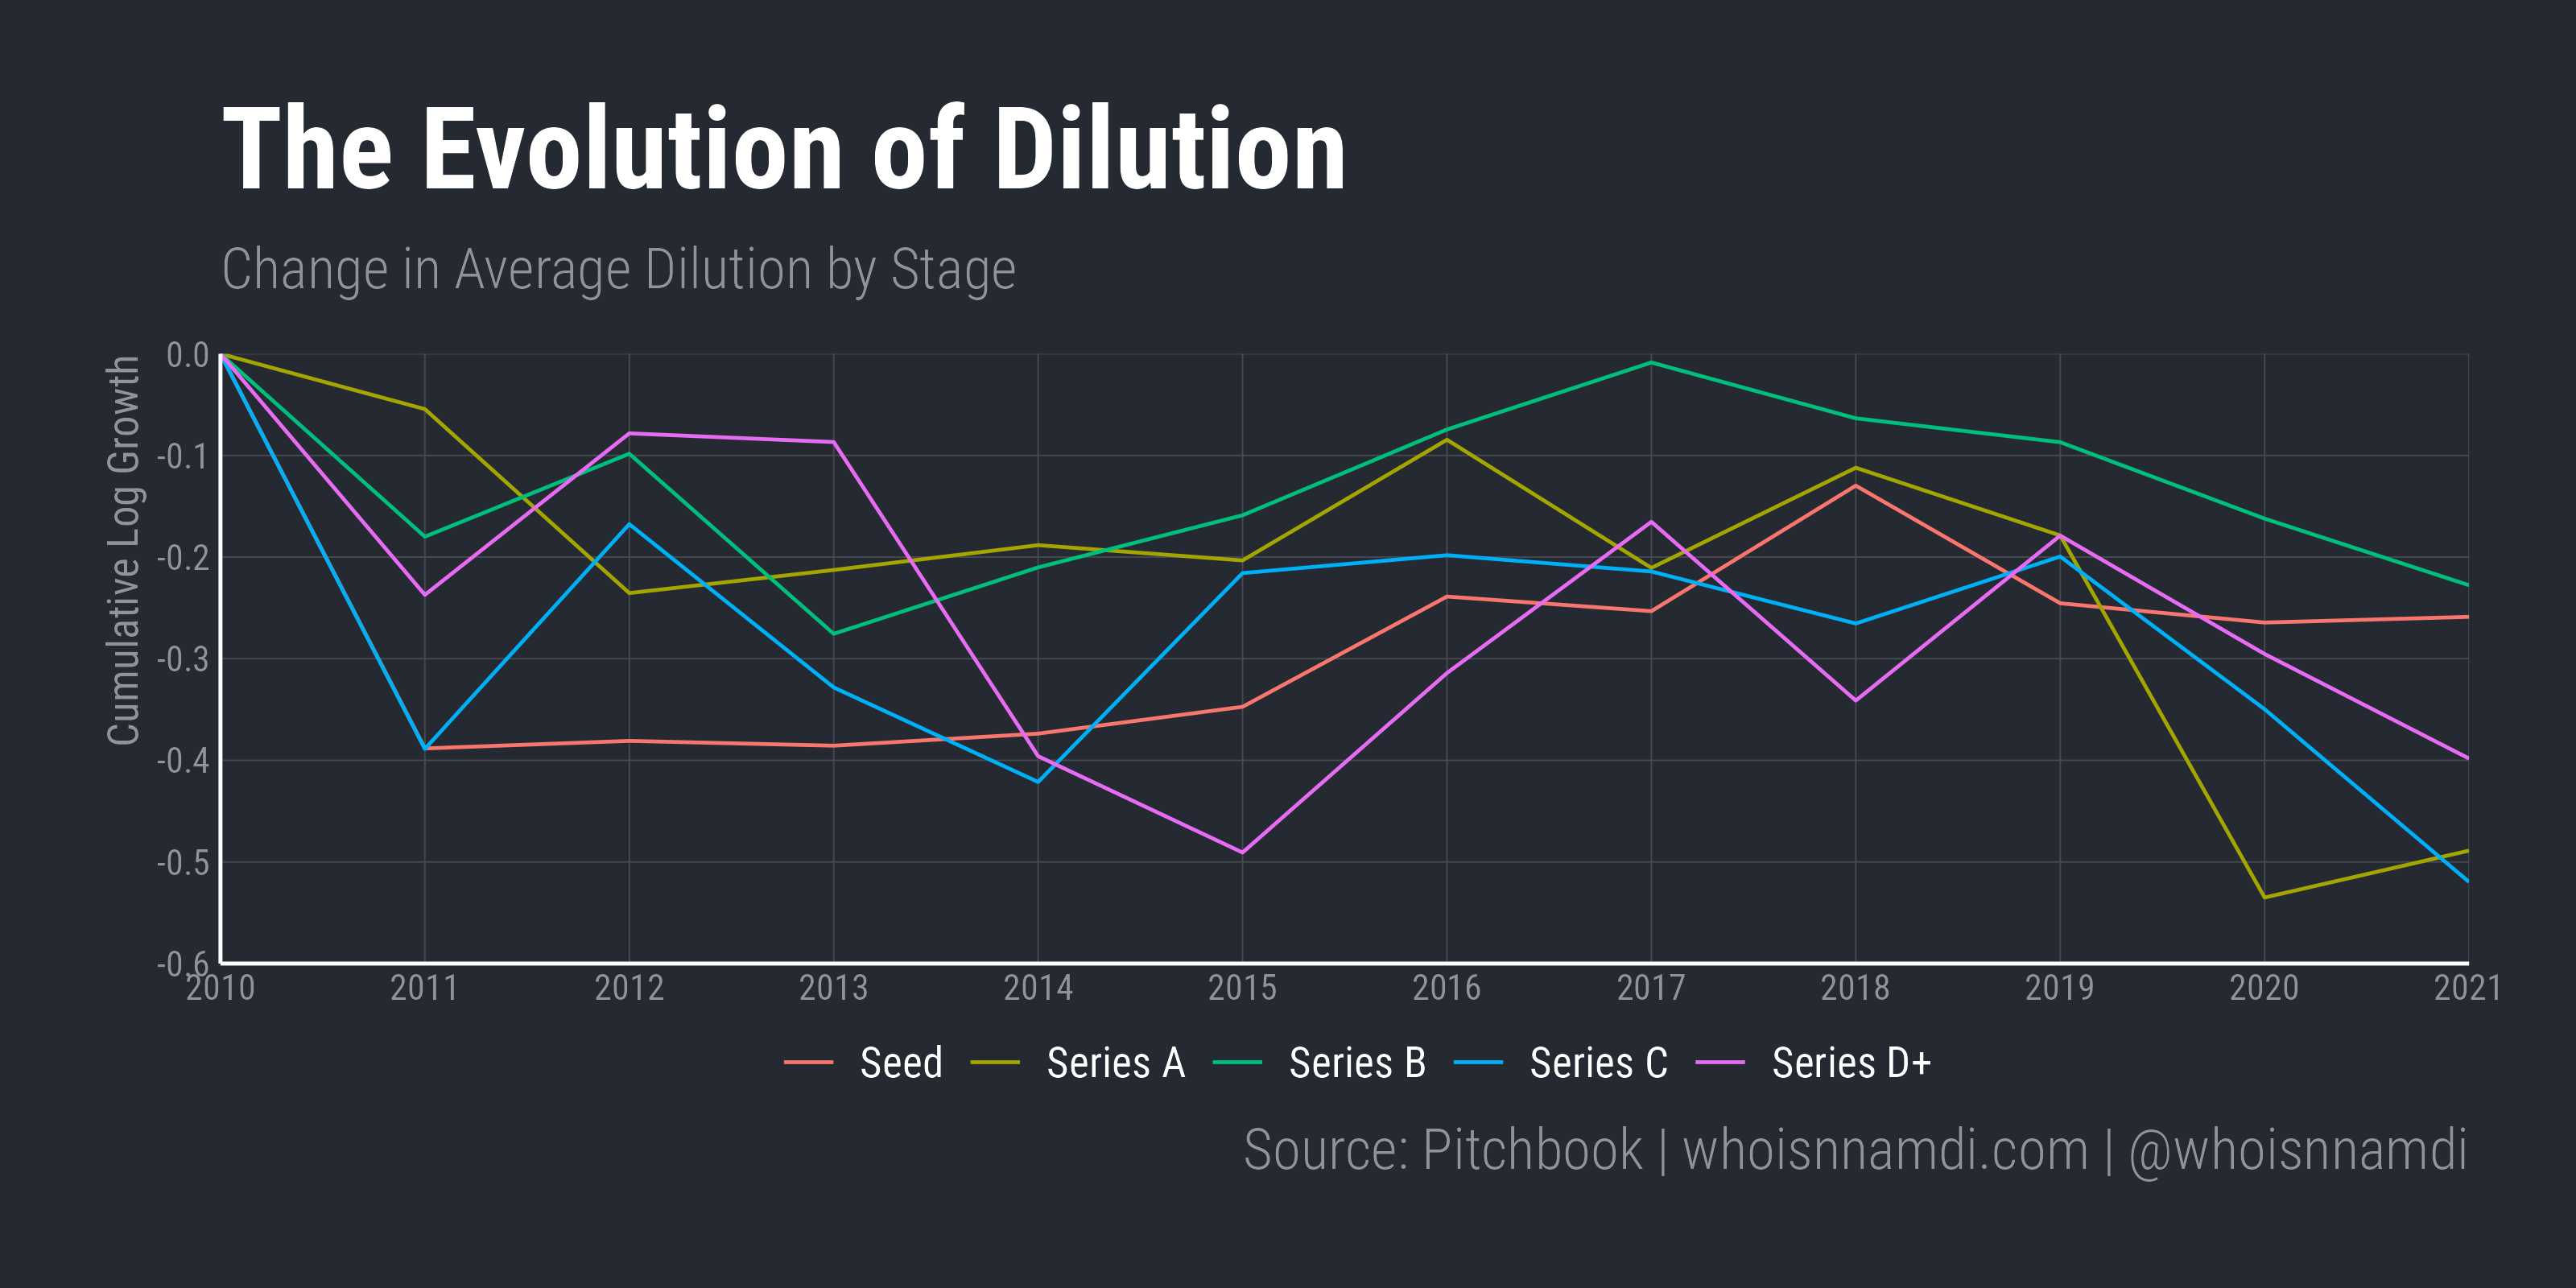
- Dilution has fallen in every stage since 2010
- Dilution at the Series A and C has fallen the most, while dilution at the Series B has fallen the least
- Dilution evolved similarly across stages through 2019, but for whatever reason, VCs over the last few years were much less desperate to "get their ownership" in Series A, C, and D+ rounds
Note that falling dilution negatively impacts funding volume since less equity gets sold.
Multivariable calculus
And now, the main event.
For every financing stage, let's aggregate the change in deals, valuations, and dilution to explain the cumulative growth of funding:
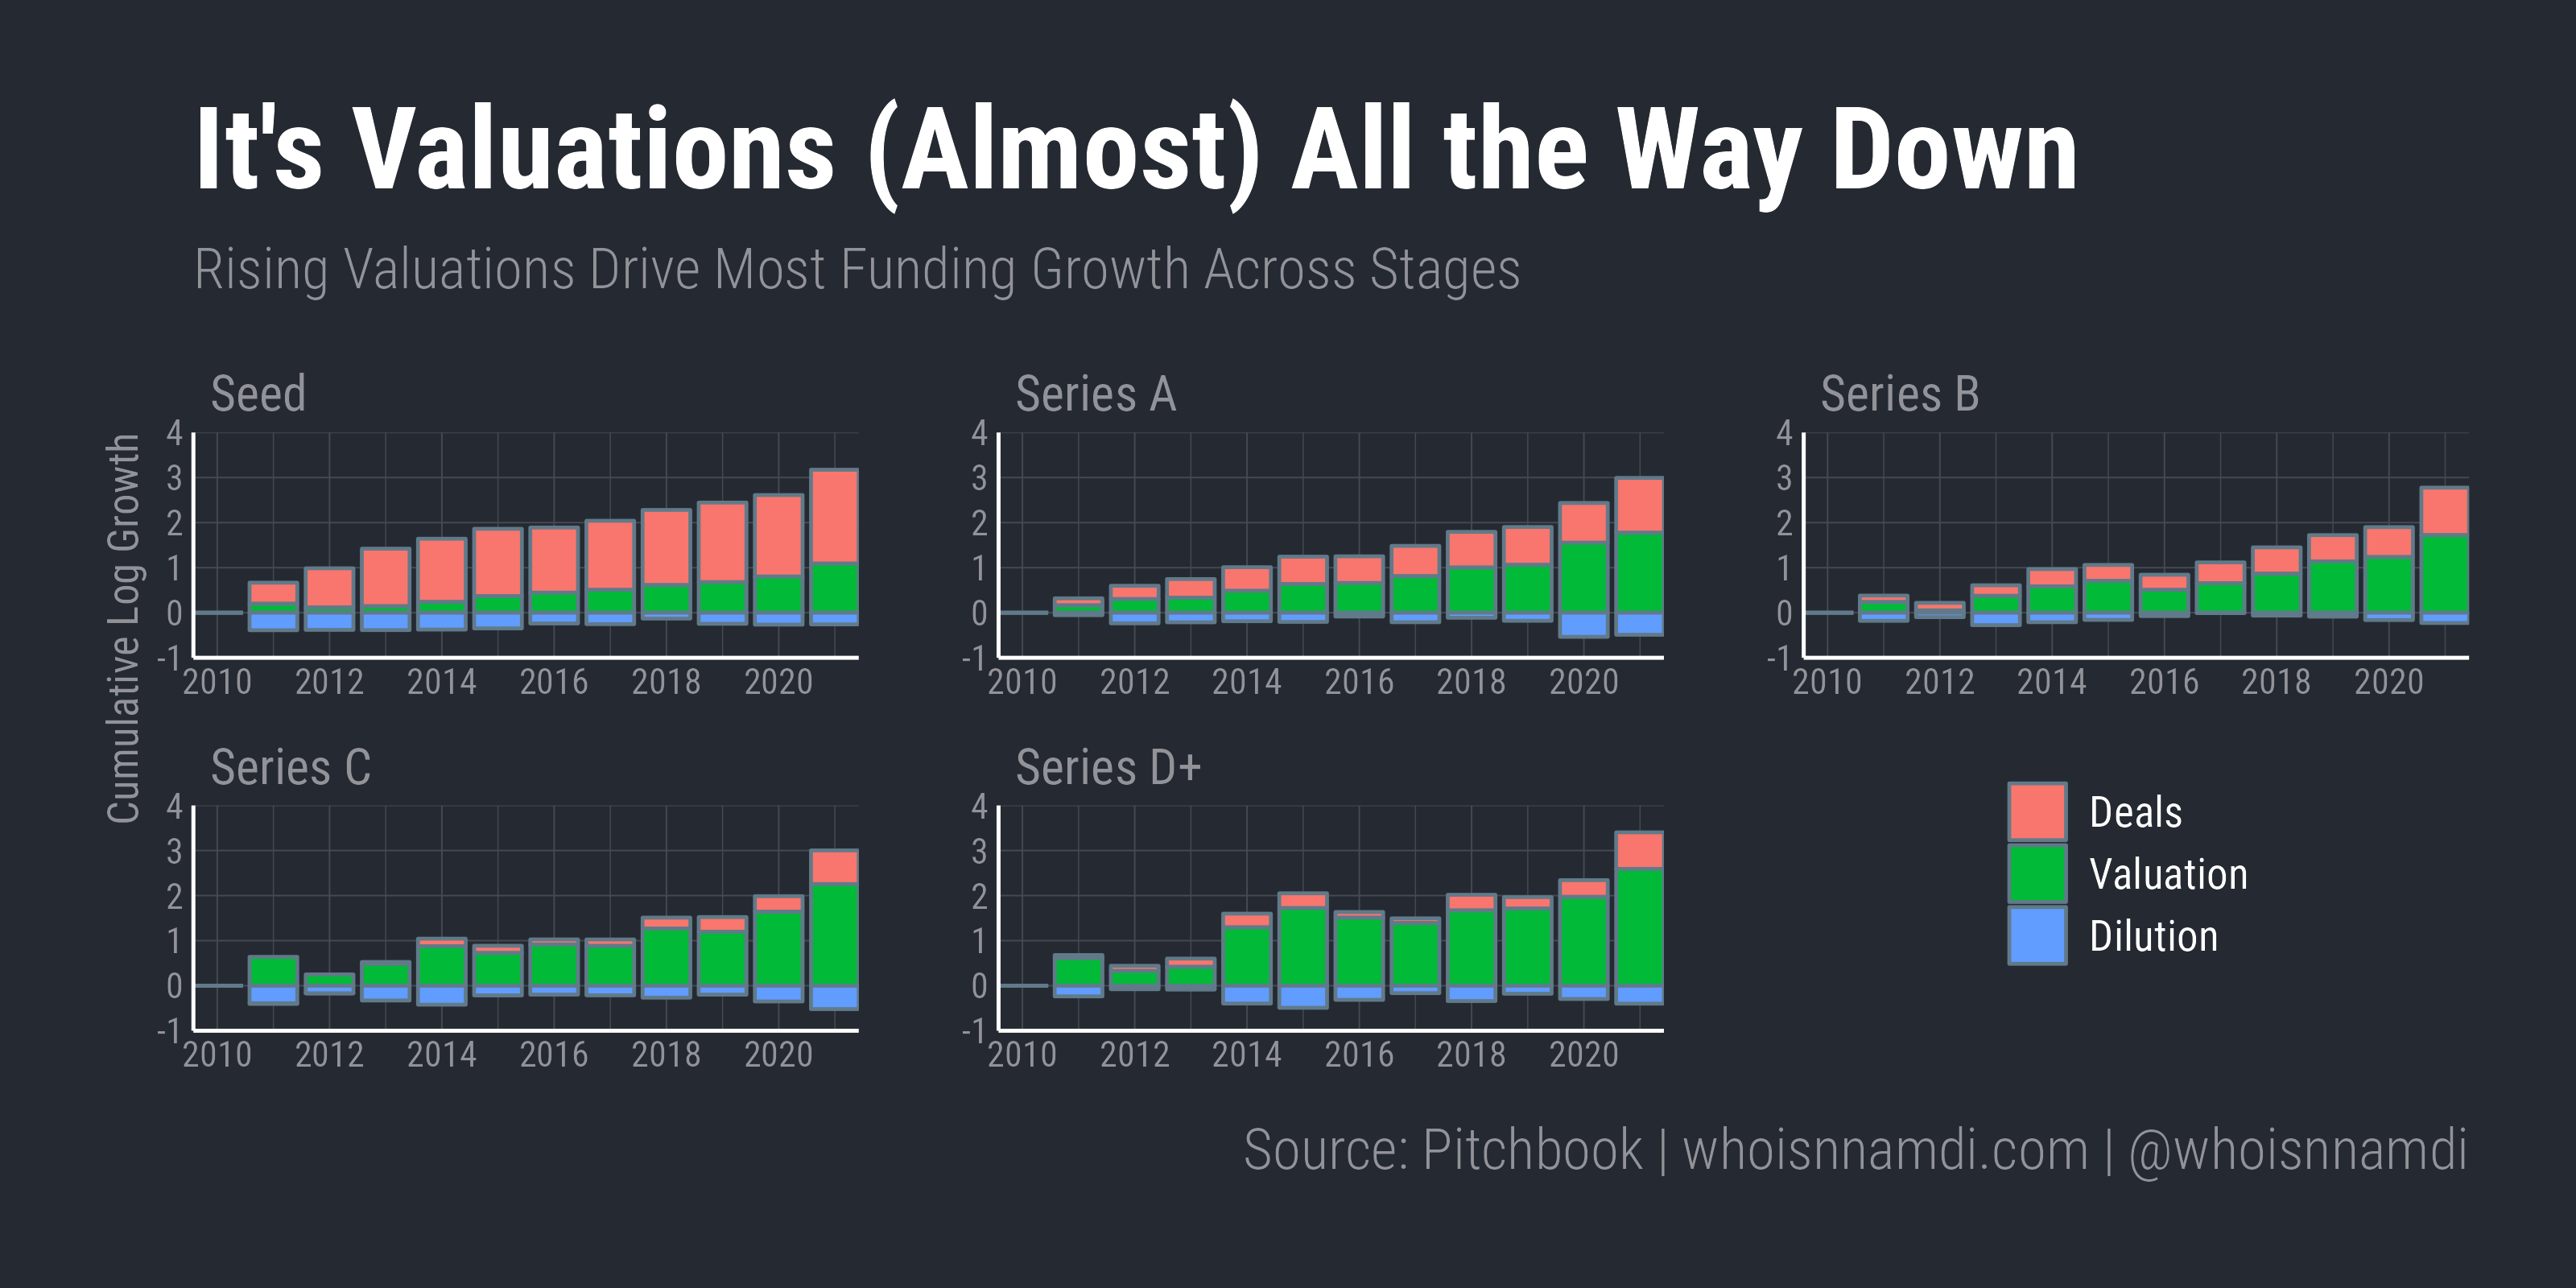
- At the Seed stage, most funding growth came from more deals getting done. Valuations rose too, but deal count explains most of the overall funding growth
This seems healthy – growth in funding should ideally come from growth in the total number of deals.
- It's a completely different story at every other stage: valuations explain most of the growth in funding at Series A and later.
- At the later-stage, valuation inflation explains nearly *all* growth in venture funding over the last eleven years
In contrast to the Seed stage, this seems unhealthy: growth in the majority of the venture ecosystem (at least as measured in dollars) over the last decade was primarily driven by rising valuations.
Now, if you've spent a lot of time staring at data like I have, you'll know that these sorts of analyses can be very dependent on the starting year (in this case, 2010).
Just to be safe, we can avoid privileging any particular year as the starting point by instead calculating the variance in funding levels over time rather than the growth. Variance decomposes the same way as growth, but this time there won't be a "base year" affecting the results.
Do this, and the conclusion is the same – year-to-year variation in valuations accounts for most of the variance in funding volume over time at the later stages:
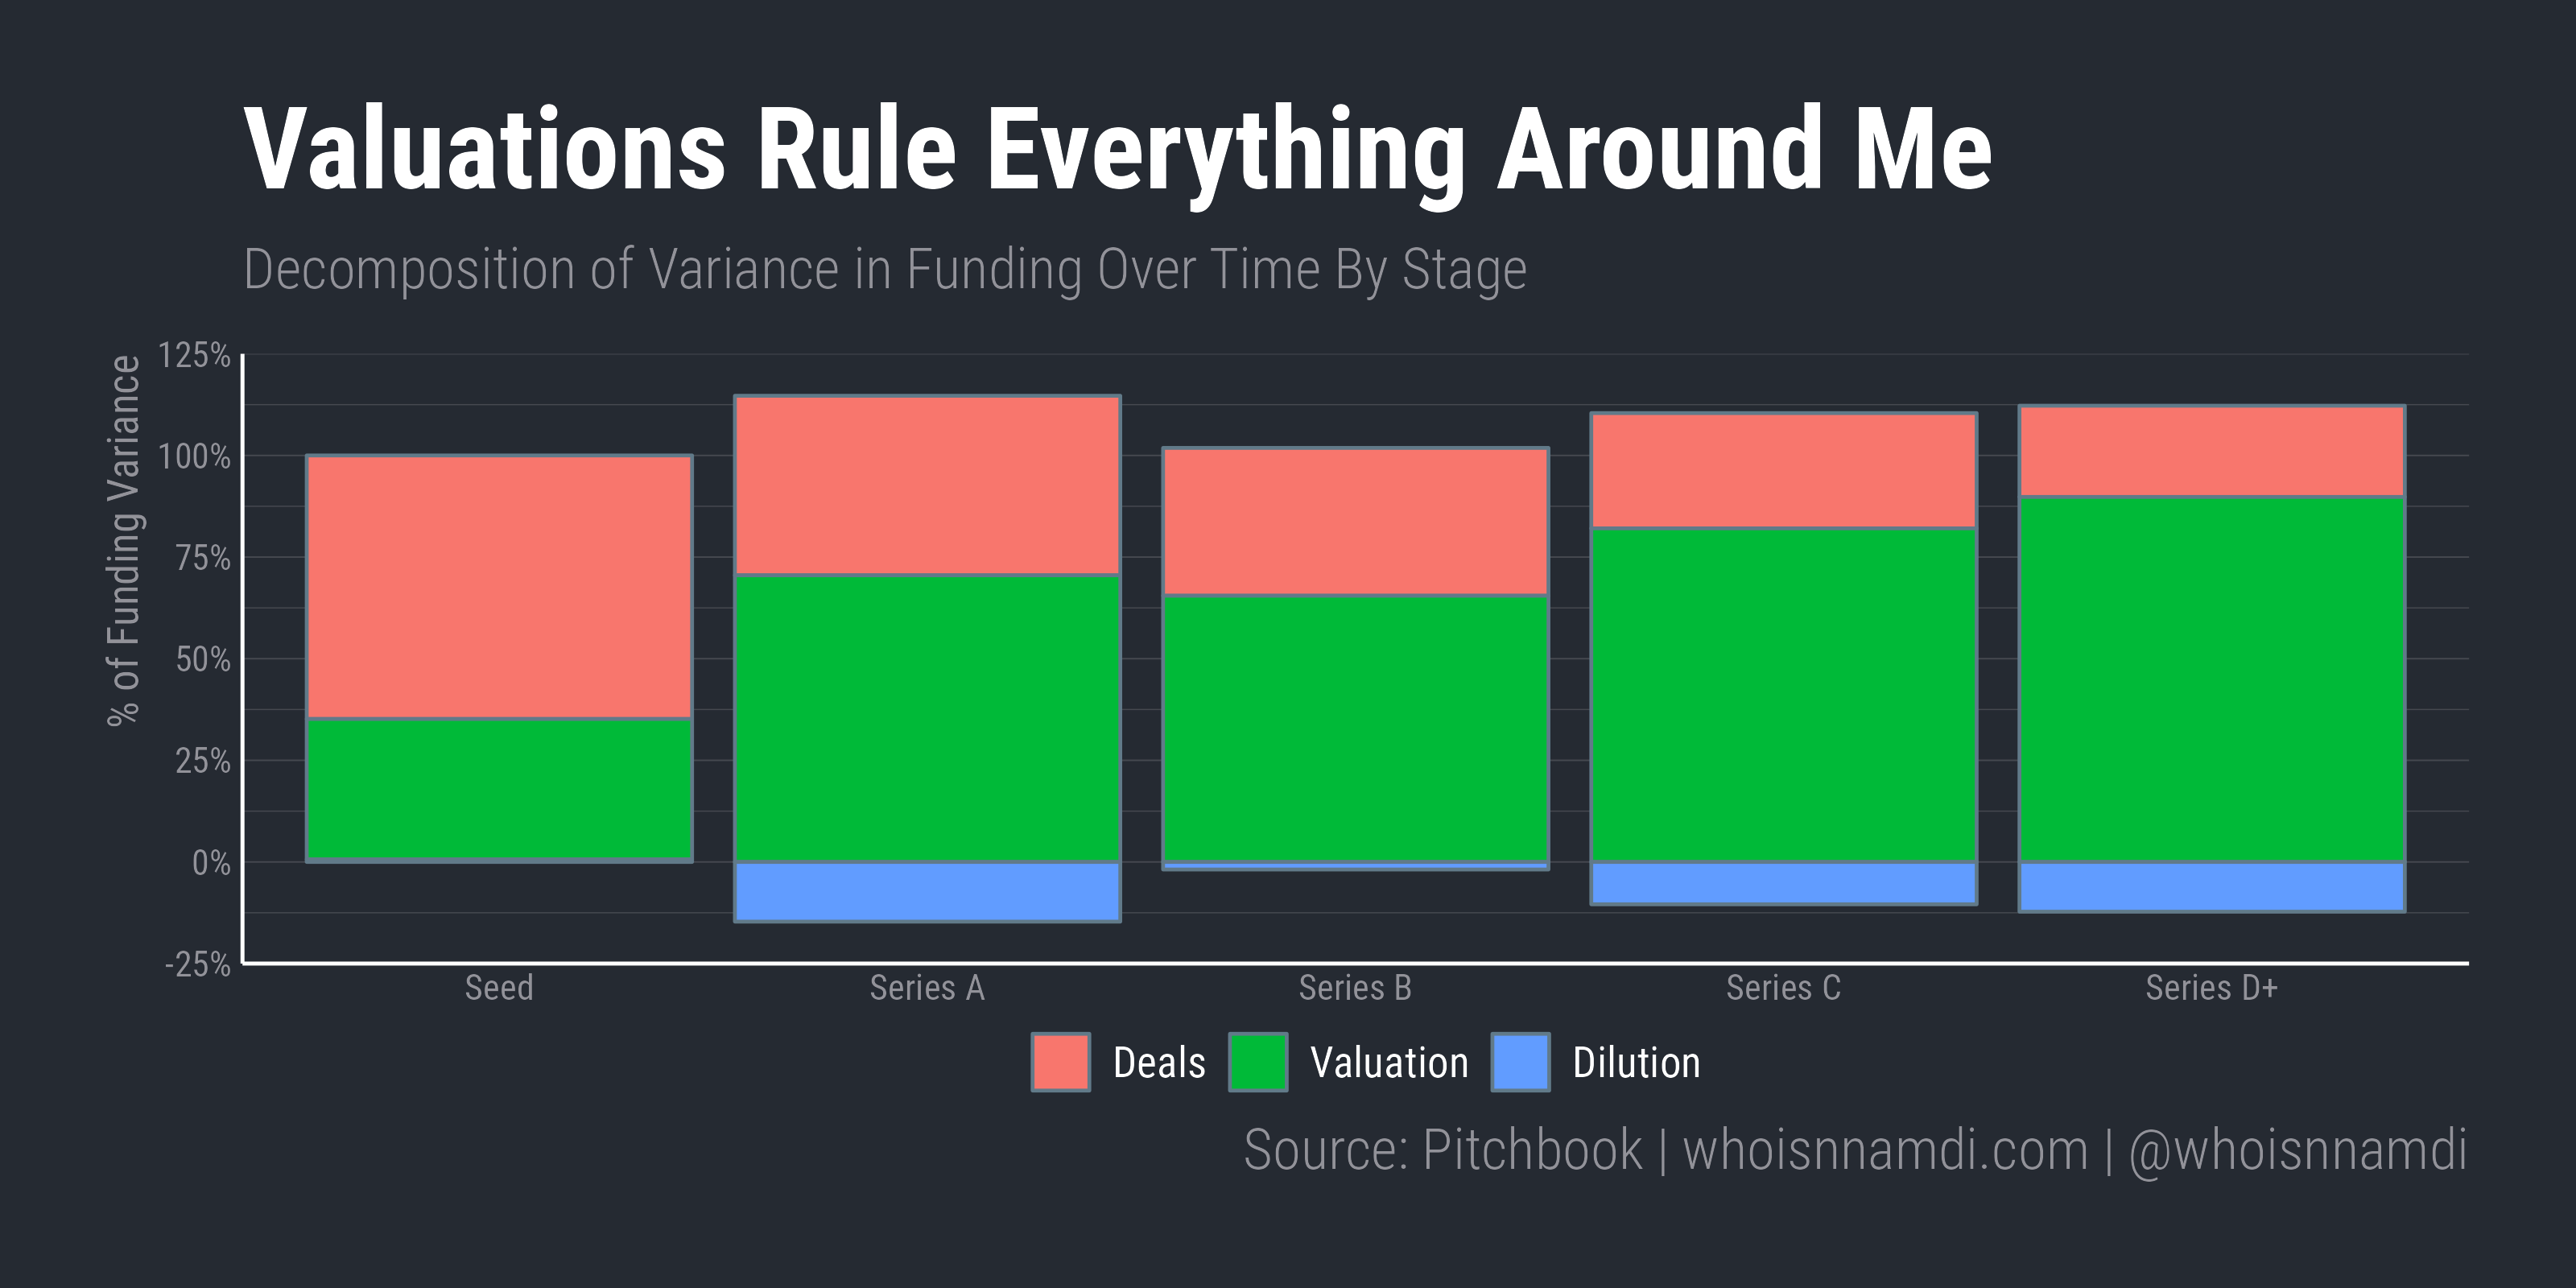
- At the seed stage, two-thirds of funding variance over time is accounted for by deal volume and one-third by valuations
- At Series A and B, 65-70% of funding variance is explained by valuations
- At Series C and later, valuations account for more than 80% of the annual variance in venture capital funding
In economics, when quantities and prices rise together, you can be fairly sure it's driven by growth of demand, or equivalently, you know the market in question is supply constrained:
- The supply of startup equity at the later stages is constrained; there's only so much of it to go around
- On the other hand, investor demand for venture assets has exploded, especially at the later stages where companies have been significantly de-risked
In this sense, the valuation inflation we've seen "comes from" the incredible growth in demand and lack of supply of startup equity.
Real analysis
Here's another trick – if we go back to our decomposition and divide both sides by valuation, we get the following:
In other words, we can adjust funding volume by the average valuation at which these financings occurred to get a "valuation-adjusted" funding metric. This is analogous to how economists "deflate" nominal GDP by inflation (e.g. CPI or similar) to arrive at "real" GDP.
It's also the result of multiplying deal count each year by average dilution, i.e. the total equity bought and sold in the venture market each year.
This lets us measure "real" growth in venture funding rather than dollar-based growth, which conflates deal activity with valuation movements.
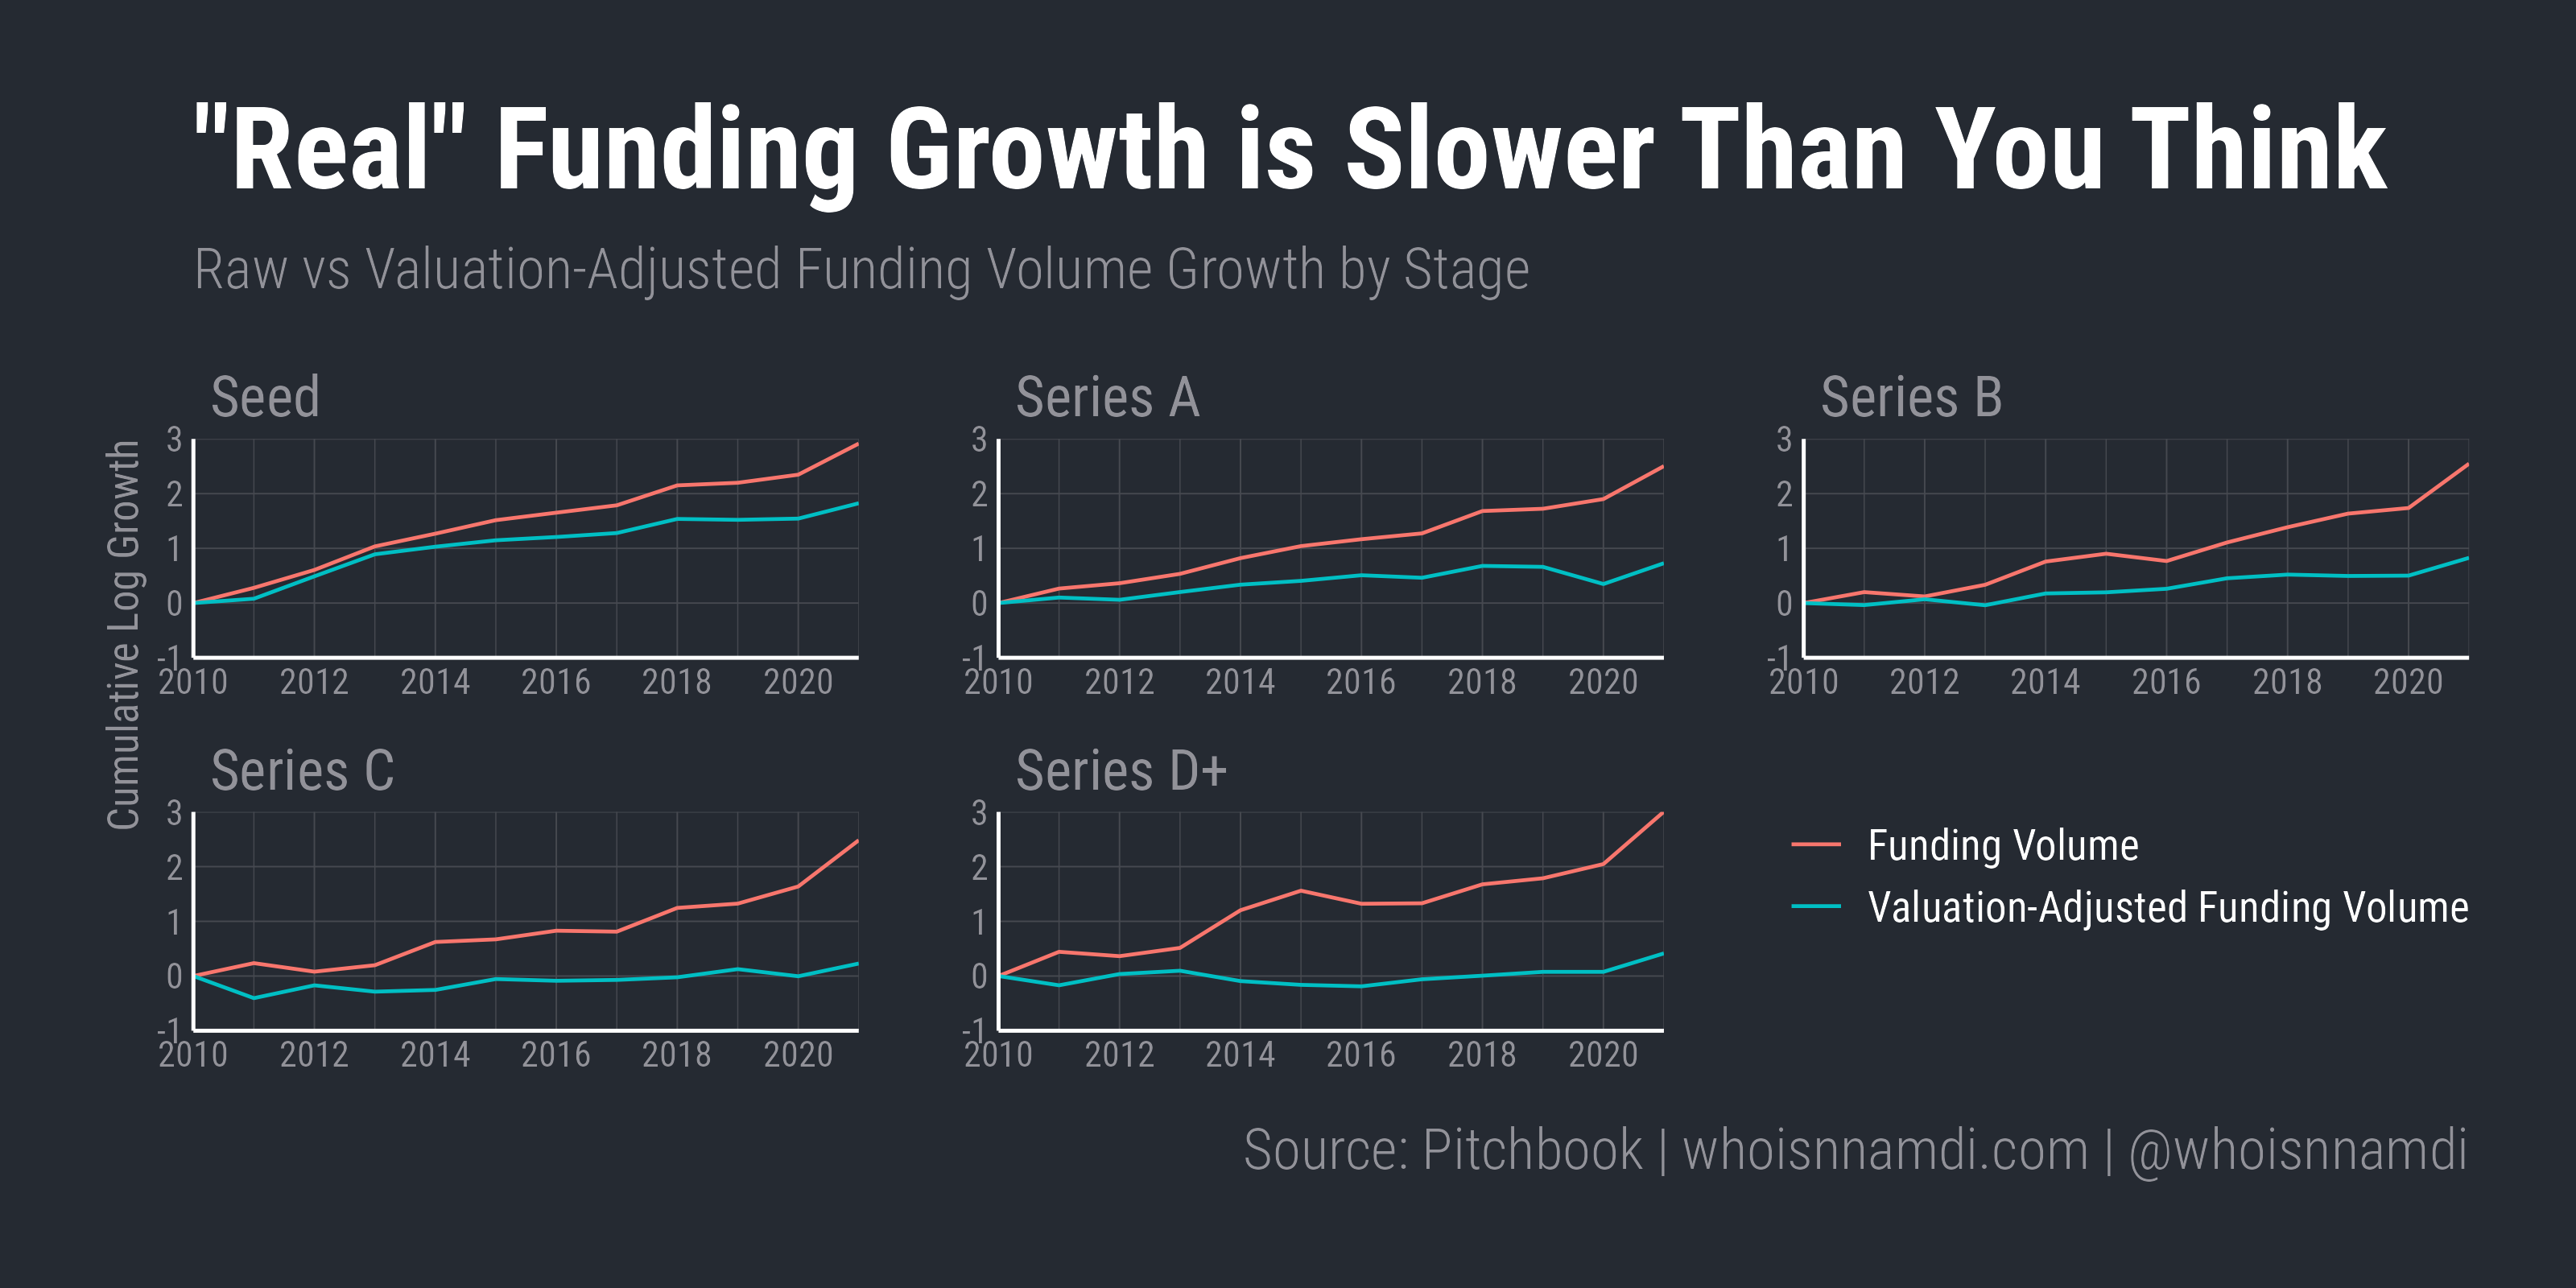
Compare this "real" funding metric to the "nominal" one I showed earlier:
Wow.
Real venture funding is growing much, much slower than you think:
- At the Seed stage, real funding growth has a 17% CAGR vs. 27% for raw funding dollars
- At the Series A and B, real funding grew at a 7% CAGR vs. 23% for nominal funding, one-third the rate
- Real funding was flat for a decade at the later stages before finally ticking up in the heydays of 2021. Real annual growth is only 2% and 4% at the Series C and D+ respectively, vs. 23 and 27% without adjustment
I want to state this as directly as possible: there was no growth in real late-stage funding activity for a decade until the bonanza of 2021.
Said differently, no more late-stage equity traded hands in 2020 than in 2010, measured in terms of points of cap table ownership.
Now you're ready for Economics 101
This data contradicts the common narratives of the past decade of growth in the venture ecosystem.
Venture capital is about two things, ventures and capital.
Capital has been in excess supply the last decade, but ventures haven't.
Valuations can't rise forever, so over the long-run venture capital can't grow much faster than the number of ventures themselves.
In a way it all makes sense:
- By the time startups graduate to the later stages, they are real companies, typically with meaningful revenue, operations, and headcount
- Accordingly, their total count should grow roughly in line with the real growth rate of modern, industrialized economies. We wouldn't expect an order of magnitude difference, otherwise late-stage startups would overtake the whole economy
In other ways, it's highly concerning:
- The supply of late-stage startup equity hasn't risen to match investor demand
- Perhaps this explains why late-stage funding seems so anemic right now - activity has reverted back to the zero-growth trend, which feels quite slow relative to the flurry of 2021 deal-making
The venture ecosystem is supply-constrained – there isn't nearly enough startup equity out there to satisfy investor demand.
Additional capital drives opportunistic company formation at the Seed stage. However, the additional capital doesn't improve survival to the later stages – it simply drives prices up for the remaining companies.
I've long felt this but never had the data to back it up.
Now I do, and I think it's a big problem.
